10-K: Annual report pursuant to Section 13 and 15(d)
Published on March 1, 2023
UNITED STATES
SECURITIES AND EXCHANGE COMMISSION
Washington, D.C. 20549
FORM
(Mark One)
ANNUAL REPORT PURSUANT TO SECTION 13 OR 15(d) OF THE SECURITIES EXCHANGE ACT OF 1934 |
For the fiscal year ended
OR
TRANSITION REPORT PURSUANT TO SECTION 13 OR 15(d) OF THE SECURITIES EXCHANGE ACT OF 1934 FOR THE TRANSITION PERIOD FROM TO |
Commission File Number
(Exact name of Registrant as specified in its Charter)
|
(State or other jurisdiction of incorporation or organization) |
(I.R.S. Employer Identification No.) |
|
|
|
(Address of principal executive offices) |
(Zip Code) |
Registrant’s telephone number, including area code: (
Securities registered pursuant to Section 12(b) of the Act:
Title of each class |
|
Trading Symbol(s) |
|
Name of each exchange on which registered |
|
|
Securities registered pursuant to Section 12(g) of the Act: None
Indicate by check mark if the registrant is a well-known seasoned issuer, as defined in Rule 405 of the Securities Act. Yes ☐
Indicate by check mark if the registrant is not required to file reports pursuant to Section 13 or 15(d) of the Act. Yes ☐
Indicate by check mark whether the registrant: (1) has filed all reports required to be filed by Section 13 or 15(d) of the Securities Exchange Act of 1934 during the preceding 12 months (or for such shorter period that the registrant was required to file such reports), and (2) has been subject to such filing requirements for the past 90 days.
Indicate by check mark whether the registrant has submitted electronically every Interactive Data File required to be submitted pursuant to Rule 405 of Regulation S-T (§232.405 of this chapter) during the preceding 12 months (or for such shorter period that the registrant was required to submit such files).
Indicate by check mark whether the registrant is a large accelerated filer, an accelerated filer, a non-accelerated filer, smaller reporting company, or an emerging growth company. See the definitions of “large accelerated filer,” “accelerated filer,” “smaller reporting company,” and “emerging growth company” in Rule 12b-2 of the Exchange Act.
|
☒ |
|
Accelerated filer |
|
☐ |
|
|
|
|
|
|||
Non-accelerated filer |
|
☐ |
|
Smaller reporting company |
|
|
|
|
|
|
|
|
|
Emerging growth company |
|
|
|
|
|
|
If an emerging growth company, indicate by check mark if the registrant has elected not to use the extended transition period for complying with any new or revised financial accounting standards provided pursuant to Section 13(a) of the Exchange Act. ☐
Indicate by check mark whether the registrant has filed a report on and attestation to its management’s assessment of the effectiveness of its internal control over financial reporting under Section 404(b) of the Sarbanes-Oxley Act (15 U.S.C. 7262(b)) by the registered public accounting firm that prepared or issued its audit report.
If securities are registered pursuant to Section 12(b) of the Act, indicate by check mark whether the financial statements of the registrant included in the filing reflect the correction of an error to previously issued financial statements. ☐
Indicate by check mark whether any of those error corrections are restatements that required a recovery analysis of incentive-based compensation received by any of the registrant’s executive officers during the relevant recovery period pursuant to §240.10D-1(b). ☐
Indicate by check mark whether the registrant is a shell company (as defined in Rule 12b-2 of the Exchange Act). Yes ☐ No
The aggregate market value of the voting and non-voting common equity held by non-affiliates of the registrant, based on the closing price of the shares of Class A common stock on The Nasdaq Global Select Market on June 30, 2022, was $
As of February 21, 2023, there were
DOCUMENTS INCORPORATED BY REFERENCE
Portions of the registrant's Proxy Statement for its 2022 Annual Meeting of Stockholders are incorporated by reference into Part III of this Annual Report on Form 10-K to the extent stated herein. Such Proxy Statement will be filed with the Securities and Exchange Commission within 120 days of the registrant's fiscal year ended .
2
ACV Auctions Inc.
Form 10-K
For the Fiscal Year Ended December 31, 2022
Table of Contents
|
|
Page |
|
|
|
Item 1. |
6 |
|
Item 1A. |
14 |
|
Item 1B. |
43 |
|
Item 2. |
43 |
|
Item 3. |
43 |
|
Item 4. |
43 |
|
|
|
|
|
|
|
Item 5. |
44 |
|
Item 6. |
45 |
|
Item 7. |
Management’s Discussion and Analysis of Financial Condition and Results of Operations |
46 |
Item 7A. |
65 |
|
Item 8. |
66 |
|
Item 9. |
Changes in and Disagreements With Accountants on Accounting and Financial Disclosure |
98 |
Item 9A. |
98 |
|
Item 9B. |
99 |
|
Item 9C. |
Disclosure Regarding Foreign Jurisdictions that Prevent Inspections |
99 |
|
|
|
|
|
|
Item 10. |
100 |
|
Item 11. |
100 |
|
Item 12. |
Security Ownership of Certain Beneficial Owners and Management and Related Stockholder Matters |
100 |
Item 13. |
Certain Relationships and Related Transactions, and Director Independence |
100 |
Item 14. |
100 |
|
|
|
|
|
|
|
Item 15. |
101 |
|
Item 16. |
104 |
|
|
105 |
1
SPECIAL NOTE REGARDING FORWARD-LOOKING STATEMENTS
This Annual Report on Form 10-K contains forward-looking statements within the meaning of Section 27A of the Securities Act of 1933, as amended, or the Securities Act, and Section 21E of the Securities Exchange Act of 1934, as amended, or the Exchange Act, about us and our industry that involve substantial risks and uncertainties. All statements other than statements of historical facts contained in this Annual Report on Form 10-K including statements regarding our future results of operations or financial condition, business strategy and plans and objectives of management for future operations, are forward-looking statements. In some cases, you can identify forward-looking statements because they contain words such as “anticipate,” “believe,” “contemplate,” “continue,” “could,” “estimate,” “expect,” “intend,” “may,” “plan,” “potential,” “predict,” “project,” “should,” “target,” “will” or “would” or the negative of these words or other similar terms or expressions. These forward-looking statements include, but are not limited to, statements concerning the following:
2
You should not rely on forward-looking statements as predictions of future events. The outcome of the events described in these forward-looking statements is subject to risks, uncertainties and other factors described under the header “Risk Factors” and elsewhere in this Annual Report on Form 10-K. Moreover, we operate in a very competitive and rapidly changing environment. New risks and uncertainties emerge from time to time, and it is not possible for us to predict all risks and uncertainties that could have an impact on the forward-looking statements contained herein. The results, events and circumstances reflected in the forward-looking statements may not be achieved or occur, and actual results, events or circumstances could differ materially from those described in the forward-looking statements.
In addition, statements that “we believe” and similar statements reflect our beliefs and opinions on the relevant subject. These statements are based on information available to us as of the date of this Annual Report on Form 10-K. While we believe that information provides a reasonable basis for these statements, that information may be limited or incomplete. Our statements should not be read to indicate that we have conducted an exhaustive inquiry into, or review of, all relevant information. These statements are inherently uncertain, and investors are cautioned not to unduly rely on these statements.
The forward-looking statements made in this Annual Report on Form 10-K relate only to events as of the date on which the statements are made, and we undertake no obligation to update them to reflect events or circumstances after the date of this Annual Report on Form 10-K or to reflect new information or the occurrence of unanticipated events, except as required by law.
Unless the context otherwise indicates, references in this report to the terms “ACV Auctions,” “ACV,” “the Company,” “we,” “our” and “us” refer to ACV Auctions Inc. and its subsidiaries.
We may announce material business and financial information to our investors using our investor relations website (www.investors.acvauto.com). We therefore encourage investors and others interested in ACV to review the information that we make available on our website, in addition to following our filings with the Securities and Exchange Commission (the "SEC"), webcasts, press releases and conference calls.
3
SUMMARY RISK FACTORS
Investing in our Class A Common Stock involves numerous risks, including the risks described in “Part I—Item 1A. Risk Factors” of this Annual Report on Form 10-K. Below are some of our principal risks, any one of which could materially adversely affect our business, results of operations, financial condition, and prospects:
4
MARKET, INDUSTRY AND OTHER DATA
The statistical data, estimates and forecasts referenced throughout this Annual Report on Form 10-K are based on independent industry publications or other publicly available information, as well as information based on our internal sources. While we believe the industry and market data included in this Annual Report on Form 10-K are reliable and are based on reasonable assumptions, the data involves many assumptions and limitations, and you are cautioned not to give undue weight to these estimates. We have not independently verified the accuracy or completeness of the data contained in these industry publications and other publicly available information. None of the industry publications referred to in this Annual Report on Form 10-K were prepared on our or on our affiliates’ behalf or at our expense. The industry in which we operate is subject to a high degree of uncertainty and risk due to a variety of factors, including those described in the section titled “Risk Factors” and “Special Note Regarding Forward-Looking Statements,” that could cause results to differ materially from those expressed in these publications and other publicly available information.
5
PART I
Item 1. Business.
Overview
Our mission is to build and enable the most trusted and efficient digital marketplaces for buying and selling used vehicles with transparency and comprehensive data that was previously unimaginable.
We provide a vibrant digital marketplace for wholesale vehicle transactions and data services that offer transparent and accurate vehicle information to our customers. Our platform leverages data insights and technology to power our digital marketplace and data services, enabling our dealers and commercial partners to buy, sell, and value vehicles with confidence and efficiency. We strive to solve the challenges that the used automotive industry has faced for generations and provide powerful technology-enabled capabilities to our dealers and commercial partners who fulfill a critical role in the automotive ecosystem. We help dealers source and manage inventory and accurately price their vehicles as well as process payments, transfer titles and manage arbitrations, and finance and transport vehicles. Our platform encompasses:
We power our marketplace with technology-driven products and value-added services that address the entire transaction journey, ranging from pre-inspection scheduling to post-auction services including title transferability verification, payment processing, financing, and transportation, and facilitate transactions both on and off our marketplace. Our comprehensive suite of services include ACV Transportation, ACV Capital, and our Customer Assurance (Go Green), which help create a seamless and frictionless buying and selling experience for our customers to further enhance our digital marketplace. We also provide data services to our customers for use outside of our marketplace. Our True360 Reports are used by dealers and commercial partners to provide transparent vehicle information to potential buyers, including dealers as well as consumers. Our Max Digital inventory management system enables dealers to accurately price their wholesale and retail inventory. We believe the data and technology services enabled by our platform can bring value to the entire automotive industry and transform both wholesale and retail markets.
Our platform benefits from a virtuous cycle driven by our scaled, digital marketplace and the data and technology we leverage every day. More buyers and sellers engaging on our marketplace drives greater liquidity and greater vehicle selection, which leads to an overall better marketplace experience. This leads to greater scale, driving more vehicle and market data that helps grow our data and technology moat. As we collect more vehicle and market data, we are able to provide greater efficiency to buyers and sellers through more products, which in turn drives greater marketplace supply and scale. For example, our data and technology enables economies of scale that improve our value-added transportation and financing services. As we continue to grow and offer more comprehensive and efficient services, our customers can further benefit from a more streamlined, simple, and consistent experience across the full used vehicle lifecycle. These reinforcing flywheel effects continuously improve our scaled, digital marketplace, and data and technology for our customers, resulting in growth for our platform.
6
We continue to invest in growth to scale our company responsibly and drive towards profitability. See the section titled “Management’s Discussion and Analysis of Financial Condition and Results of Operations—Key Operating and Financial Metrics” for additional information on Marketplace Units, Marketplace GMV, and Adjusted EBITDA.
Our Platform
Our platform leverages data and technology to power our digital marketplace and data services, enabling our dealers and commercial partners to buy, sell, and value vehicles with confidence and efficiency. Our digital marketplace offerings include our core auction offering and value-added services, ACV Transportation, ACV Capital, and our Customer Assurance (Go Green). Our data services provide insights into the condition and value of used vehicles for transactions both on and off our marketplace. Our core data and technology platform includes offerings such as inspection, vehicle intelligence, marketplace enablement, and operations automation.
Digital Marketplace
Our digital marketplace connects buyers and sellers of wholesale vehicles nationwide, enabling them to transact intuitively and efficiently.
Data Services
We offer data services for our dealer and commercial partners that bring transparency and offer insights into the condition and value of used vehicles, enabling them to make more informed wholesale and retail inventory management decisions both on and off our digital marketplace.
7
Data and Technology
Data and technology are the foundations of our platform and underpin everything we do. Our core data and technology capabilities include inspection, vehicle intelligence, marketplace enablement, and operations automation.
8
Key Advantages to our Platform
Our competitive advantage results from our deep expertise in the used vehicle market, a transparent, digital approach for our dealers and commercial partners, and a comprehensive suite of products and services:
Transparent, Digital Approach Unlocks a More Efficient Market. Our digital marketplace and comprehensive suite of products and services provides greater access to trusted inventory and speed to liquidity for our dealers and commercial partners. Our differentiated approach to vehicle insights also allows us to stand behind vehicles listed on our marketplace and truly partner with our customers. We pioneered what we believe to be the wholesale market’s first seller assurance service, Go Green, which provides the seller with an assurance against claims of defects in the vehicle that are not disclosed in our condition report and which otherwise may have exposed the seller to loss as a result of arbitration with the vehicle buyer. We believe our approach instills more confidence for our customers to transact digitally and we enable transactions that may not have happened in the traditional auction process.
Industry Leading Digital Marketplace with Significant Scale. The power of our platform is evidenced through our scale and growth. In 2022, we had 14,453 active Marketplace Buyers and 10,285 active Marketplace Sellers generating $9.0 billion Marketplace GMV, which increased by 3%, 14%, and 13%, respectively, from the prior year. Our digital marketplace provides sellers with an efficient channel to wholesale their vehicles and access to thousands of dealers nationwide, and provides buyers with a real-time view of extensive vehicle inventory, all at the touch of a button. We believe our ability to build vibrant local and regional networks of Marketplace Buyers and Marketplace Sellers, combined with our nationwide coverage, creates a strong competitive advantage.
9
Comprehensive Suite of Products and Services Deepening Relationships with Our Customers. We offer a comprehensive suite of products and services that help create a seamless experience and remove the friction and pain points associated with the traditional wholesale process. Through services such as ACV Transportation and ACV Capital, we help our customers manage the entire transaction journey on our platform, becoming an integral partner and deepening our relationships with them.
Growing Technology and Data Moat. Our growing repository of data enables transparent, comprehensive, and accurate vehicle information that our customers can trust, powering more efficient and frictionless vehicle transactions both on and off our marketplace. Through the connection of hundreds of discrete data points collected along the entire used vehicle transaction journey, we improve existing products and react dynamically to our customers’ needs.
Attractive Territory Economics. As our territories mature and scale, territory-level economics tend to improve driven by more cost-efficient operations and greater customer affinity for our offerings. As we reach greater scale and higher levels of density in a territory, we typically experience lower inspection cost per vehicle and better overall economics per transaction.
Mission-Driven Culture and Proven Team. We believe the happiness of our teammates leads to successful business operations, and comes from learning and engaging in fulfilling work, which results in ample professional growth opportunities. Additionally, we represent the successful creation of an entrepreneurial ecosystem in our hometown, and our success enables us to attract some of the best talent in the region and across the country. Our leadership team is composed of seasoned executives with demonstrated track records of scaling businesses across auto, consumer, and marketplace companies.
Sales
Our sales team is responsible for onboarding our dealers and commercial partners and ensuring their success and satisfaction on our platform. We have built a robust internal sales team that act as account managers, and partner with our customers. Account managers are often the first point of contact for customers seeking to join our platform, and develop meaningful relationships with our dealers and commercial partners. We also have a dedicated sales development team that proactively sources new customers, particularly for our more nascent territories or in existing territories where we seek to improve our buyer to seller ratio. After dealers are on-boarded onto our platform, they can interact with their account managers through in-app messaging, by email, or by phone.
Our territory managers also function as sales representatives, particularly in more nascent territories where they develop personal relationships with local dealers. When launching and entering new territories, our dedicated on the ground team, including territory managers, VCIs, and other operations staff, target and onboard dealers in the respective territory with an appropriate balance of buyers and sellers to encourage vibrancy in the marketplace. Territory managers continue to support our dealers, building awareness of our brand in the regions in which they operate. Our VCIs serve as a sales support team by building and cultivating relationships with our customers through multiple weekly visits to customers in their territories. Given the strength of their relationships and frequency of interaction with our dealers, VCIs often double as informal relationship managers and can be a key point of contact for dealers on our platform.
Marketing
We build and cultivate relationships with our dealer and commercial partners, with the goal of providing a streamlined, simple, and consistent experience for our customers. Marketing campaigns and promotions are used throughout the transaction journey to guide the customer through the funnel, cross-sell offerings and ultimately reach their full volume potential with ACV.
10
Our marketing initiatives aim to drive brand awareness, incentivize our existing partners to remain engaged and active in our marketplace, and attract new dealers and commercial partners to our platform. We are focused on building a world-class acquisition engine led by our marketing team and in partnership with our VCIs, business development representatives and account managers. Our customer acquisition efforts are strategically aligned to territories or regions that could benefit from dealer development. We are focused on increasing retention and growing wallet share with our customers.
We acquire new customers through a variety of marketing channels including digital (e.g. paid search, search engine optimization, display, social, video and influencer marketing), direct marketing (e.g. promotional and brand building) and outbound business development. The marketing and business development teams own the customer relationship from initial inquiry to sign-up. After onboarding they are assigned a dedicated account manager or territory manager for on-going support. Engagement with our customers is driven by ongoing and regular communications from their account managers or territory managers. Additionally, account managers and territory managers determine appropriate promotions to re-engage buyers and sellers, as well as an incentive for new customers to sign-up and engage.
Competition
We mainly compete with large, national physical vehicle auction companies, such as Manheim, a subsidiary of Cox Enterprises, Inc., Adesa, a subsidiary of Carvana, and KAR Auction Services. The physical vehicle auction market in North America is largely consolidated, with Manheim and Adesa serving as large players in the market. Manheim has expanded into online wholesale marketplaces and auctions, and KAR Auction Services is also competing in the online wholesale auction market. However, we do compete with smaller chains of auctions and independent auctions in the physical market. We also compete with a number of smaller digital marketplace companies.
Human Capital and Culture
We believe the development and empowerment of our people is critical to our ability to deliver differentiated solutions to our customers. We strive to be a great place to work—a place where we welcome innovation, diversity, inclusion, and foster a spirit of community from our corporate headquarters to our teammates in the field. We give our teammates the freedom, tools, resources, and opportunity to build the future—for our company, our customers, and our communities. We hire happy and enthusiastic people who want to grow with us. We believe the happiness of our teammates comes from engaging and fulfilling work and from ample personal and professional growth opportunities. We strive to ensure that all of our teammates have what they need to get to where they want to be, and we try our best to make it fun along the way. We invest heavily in the development of our teammates through training, internal development, and mobility options to drive growth. Together with respect, empowerment, and the spirit of innovation, we create the dynamic energy that drives our business forward.
We represent the successful creation of an entrepreneurial ecosystem in our hometown and our growth and scale highlight that the spirit of innovation is alive and well in Buffalo, New York. We are continuously building an exceptional culture that strives to drive engagement, exceed expectations, and directly impact company success.
We have a proven leadership team composed of seasoned executives with demonstrated track records of scaling businesses, as well as business leaders from across auto, consumer, and marketplace businesses. As of December 31, 2022, we had over 2,000 teammates, including our more than over 760 highly sophisticated VCIs that help support our relationships with our customers nationwide.
Intellectual Property
We rely on a combination of federal, state, common law and international legal rights, as well as contractual restrictions, to protect our intellectual property, including trademarks, domain names, copyrights, trade secrets, patents and confidentiality agreements with employees and third parties. We pursue the registration of our trademarks, service marks and domain names in the United States and in certain locations outside the United States.
11
We control access to and use of our proprietary technology and other confidential information through the use of internal and external controls, including contractual protections with employees, contractors and third parties. We further control the use of our proprietary technology and intellectual property through provisions in our terms of service. We intend to pursue additional intellectual property protection to the extent we believe it would be beneficial and cost effective. Despite our efforts to protect our proprietary technology and our intellectual property rights, unauthorized parties may attempt to access, copy, obtain, use, reverse engineer, misappropriate, infringe, and otherwise violate our technology and intellectual property, including to develop platforms with the same functionality as our platform. For more information regarding the risks relating to intellectual property, see “Risk Factors—Risks Related to Information Technology and Intellectual Property.”
Seasonality
The volume of vehicles sold through our auctions generally fluctuates from quarter to quarter. This seasonality is caused by several factors, including holidays, weather, the seasonality of the retail market for used vehicles and the timing of federal tax returns, which affects the demand side of the auction industry. As a result, revenue and operating expenses related to volume will fluctuate accordingly on a quarterly basis. In the fourth quarter, we typically experience lower used vehicle auction volume as well as additional costs associated with the holidays. Seasonally depressed used vehicle auction volume typically continues during the winter months through the beginning of the first quarter. Typical seasonality trends may not be observed in periods where other external factors more significantly impact the industry.
Our Government Regulations
The industry in which we operate is and will continue to be subject to extensive U.S. federal, state, local, and international laws and regulations. The wholesale, financing and transportation of used vehicles are regulated by the states in which we operate and by the U.S. federal government. These laws can vary significantly from state to state. In addition, we are subject to regulations and laws specifically governing the internet and ecommerce and the collection, storage, processing, transfer and other use of personal information and other customer data. We are also subject to federal and state laws, such as the Equal Credit Opportunity Act and prohibitions again unfair or deceptive acts or practices.
In addition to these laws and regulations, our facilities and business operations are subject to a wide array of federal, state, local, and international laws and regulations relating to occupational health and safety, and other broadly applicable business regulations. We also are subject to laws and regulations involving taxes, data privacy and security, anti-spam, content protection, electronic contracts and communications, mobile communications, unencumbered internet access to our platform, the design and operation of websites and internet neutrality. For additional information, see “Risk Factors-Risk Factors Related to Government Regulation and Litigation—We operate in highly regulated industries and either are or may be subject to a wide range of federal, state and local laws and regulations and our failure to comply with these laws and regulations may force us to change our operations or harm our business.”
Corporate Information
We were incorporated in Delaware in December 2014. Our principal executive offices are located at 640 Ellicott Street, Suite #321, Buffalo, New York 14203, and our telephone number is (800) 553-4070. Our website address is www.acvauto.com. Information contained on, or that can be accessed through, our website is not incorporated by reference into this Annual Report on Form 10-K, and you should not consider information on our website to be part of this Annual Report on Form 10-K.
12
Available Information
Our Annual Report on Form 10-K, Quarterly Reports on Form 10-Q, Current Reports on Form 8-K, and any amendment to these reports are filed with the SEC. Such reports and other information filed by us with the SEC are available free of charge on our website at www.acvauto.com when such reports are available on the SEC’s website. The SEC maintains an internet site that contains reports, proxy and information statements and other information regarding issuers that file electronically with the SEC at www.sec.gov. The information contained on the websites referenced in this Annual Report on Form 10-K is not incorporated by reference into this filing. Further, our references to website URLs are intended to be inactive textual references only.
13
Item 1A. Risk Factors.
RISK FACTORS
Our operations and financial results are subject to various risks and uncertainties including those described below. You should consider carefully the risks and uncertainties described below, in addition to other information contained in this Annual Report on Form 10-K, including our consolidated financial statements and related notes. The risks and uncertainties described below are not the only ones we face. Additional risks and uncertainties that we are unaware of, or that we currently believe are not material, may also become important factors that adversely affect our business. If any of the following risks or others not specified below materialize, our business, results of operations, and financial condition could be materially and adversely affected. In that case, the trading price of our Class A common stock could decline.
Risks Related to Our Growth and Capital Requirements
Our recent growth may not be indicative of our future growth.
Our revenue was $421.5 million and $358.4 million for the years ended December 31, 2022 and 2021, respectively. You should not rely on the revenue growth of any prior period as an indication of our future performance. Even if our revenue continues to increase, we expect that our revenue growth rate will decline in the future as a result of a variety of factors, including the maturation of our business, increased competition, changes to technology, a decrease in the growth of our overall market or our failure, for any reason, to continue to take advantage of growth opportunities. Overall growth of our revenue depends on a number of additional factors, including our ability to:
We may not successfully accomplish any of these objectives, and as a result, it is difficult for us to forecast our future results of operations. If the assumptions that we use to plan our business are incorrect or change in reaction to changes in our market, or if we are unable to maintain consistent revenue or revenue growth, our stock price could be volatile, and it may be difficult to achieve and maintain profitability.
14
Our business has grown as new customers have begun to trust and use our online platform and value-added products and services as a new way to buy and sell their vehicles to other dealers. However, our business is relatively new and has operated at substantial scale for only a limited period of time. Given this limited history, it is difficult to predict whether we will be able to maintain or grow our business. Our historical revenue or revenue growth should not be considered indicative of our future performance. We have encountered, and will continue to encounter, risks and difficulties frequently experienced by growing companies in rapidly changing industries, including difficulties in our ability to achieve market acceptance of our platform, products and services and attract customers, as well as increasing competition and increasing expenses as we continue to grow our business. We also expect that our business will evolve in ways that may be difficult to predict. For example, over time our investments that are intended to drive new customer traffic to our platform may be less productive than expected. In the event of this or any other adverse developments, our continued success will depend on our ability to successfully adjust our strategy to meet changing market dynamics. If we are unable to do so, our business may be harmed.
In addition, as a result of the COVID-19 pandemic, our operating results in financial periods occurring during the pandemic may not be indicative of our future performance. Beginning in March 2020, our customers’ operations were initially significantly disrupted in certain jurisdictions, causing a temporary significant decrease in activity on our online marketplace. Our operating results were initially negatively impacted by the COVID-19 pandemic at the end of the first quarter and the beginning of the second quarter of 2020. This initial negative disruption began to subside in May 2020 as the demand for used vehicles on a national level began to outpace supply, leading to higher used vehicle valuations and a higher percentage of successful auctions, and as dealers and commercial partners looked to an online marketplace to transact remotely. These market and industry trends combined with the strength of our service offerings drove favorable operating results. You should not rely on our financial performance for any period since the start of the pandemic as an indication of our future performance. Moreover, we cannot predict how the COVID-19 pandemic will continue to develop, particularly in light of variant strains of the virus, whether and to what extent government regulations or other restrictions may impact our operations or those of our customers, or whether or to what extent the COVID-19 pandemic or the effects thereof may have longer term unanticipated impacts on our business or the global economy.
Our recent growth has placed and may continue to place significant demands on our management and our operational and financial resources. We have experienced significant growth in the number of customers on our platform as well as the amount of data that we analyze. We have hired and expect to continue hiring additional personnel to support our growth. Our organizational structure is becoming more complex as we add staff, and we will need to continue to improve our operational, financial and management controls as well as our reporting systems and procedures. This will require significant capital expenditures and the allocation of valuable management resources to grow and adapt in these areas without undermining our corporate culture of teamwork. If we cannot manage our growth effectively to maintain the quality and efficiency of our customers’ experience, our business may be harmed.
We have a history of operating losses and we may not achieve or maintain profitability in the future.
We have experienced net losses in each annual period since inception. We generated net losses of $102.2 million and $78.2 million for the years ended December 31, 2022 and 2021, respectively. As of December 31, 2022, we had an accumulated deficit of $347.4 million. While we have experienced significant revenue growth in recent periods, we are not certain whether or when we will obtain a high enough volume of revenue to sustain or increase our growth or achieve or maintain profitability in the future, particularly in light of recent macroeconomic factors. Costs and expenses could fluctuate in future periods, which could negatively affect our future results of operations. In particular, we intend to continue to expend substantial financial and other resources on:
15
Our efforts to grow our business may not be successful or may be costlier than we expect, or the rate of our growth in revenue may be slower than we expect, and we may not be able to increase our revenue enough to offset our increased operating expenses. We may incur significant losses in the future for a number of reasons, including the other risks described herein, and unforeseen expenses, difficulties, complications or delays, and other unknown events. If we are unable to achieve and sustain profitability, the value of our business and Class A common stock may significantly decrease.
We have a limited operating history, and our future results of operations or financial condition may fluctuate significantly due to a wide range of factors, which makes it difficult to forecast our future results of operations or financial condition.
We commenced operations in 2014. As a result of our limited operating history, our ability to accurately forecast our future results of operations and financial condition is limited and subject to a number of uncertainties, including our ability to plan for and model future growth. Our revenue, results of operations, cash flows and financial condition have historically varied from period to period, and we expect that they will continue to do so; therefore, our historical revenue growth should not be considered indicative of our future performance or financial condition. Further, in future periods, our revenue growth could slow, our revenue could decline and/or our financial condition may be adversely impacted for a number of reasons, many of which are outside of our control, including:
16
Any one of these or other factors discussed elsewhere herein or the cumulative effect of some of these factors may result in fluctuations in our revenue, results of operations, cash flows and financial condition, meaning that quarter-to-quarter comparisons of our revenue, results of operations, cash flows and financial condition may not necessarily be indicative of our future performance or financial condition. In addition, we release earnings guidance in our quarterly and annual earnings conference calls, quarterly and annual earnings releases, or otherwise, regarding our future performance and financial condition that represents our management’s estimates as of the date of release. Our actual business results may vary significantly from such guidance due to a number of factors, including many outside of our control, such as global economic uncertainty and market conditions, which could adversely affect our business and future results of operations or financial condition. Furthermore, we may in the future make downward revisions of our previously announced guidance. If we withdraw our previously announced guidance, or if our publicly announced guidance of future operating results or financial condition fails to meet expectations of securities analysts, investors or other interested parties, the price of our Class A common stock could decline.
We have also encountered, and will continue to encounter, other risks and uncertainties frequently experienced by growing companies in rapidly changing industries, such as the risks and uncertainties described herein. If our assumptions regarding these risks and uncertainties and our future revenue growth are incorrect or change, including as a result of changes driven by developments related to the COVID-19 pandemic and global economic factors, or if we do not address these risks successfully, our results of operations or financial condition could differ materially from our expectations, and our business may be harmed.
We track certain operational metrics with internal systems and tools and do not independently verify such metrics.
Certain of our operational metrics are subject to inherent challenges in measurement, and any real or perceived inaccuracies in such metrics may adversely affect our business, results of operations, financial condition and reputation. We track certain operational metrics, including Marketplace Buyers and Marketplace Sellers and non-GAAP metrics such as Adjusted EBITDA, with internal systems and tools that are not independently verified by any third party and which may differ from estimates or similar metrics published by third parties due to differences in sources, including internal and external, methodologies or the assumptions on which we rely. Our internal systems and tools have a number of limitations, and our methodologies for tracking these metrics may change over time, which could result in unexpected changes to our metrics, including the metrics we publicly disclose. If the systems and tools we use to track these metrics undercount or overcount performance or contain algorithmic or other technical errors, the data we report may not be accurate. While these numbers are based on what we believe to be reasonable estimates of our metrics for the applicable period of measurement, there are inherent challenges in measuring how our marketplace is used across large populations. In addition, limitations or errors with respect to how we measure data or with respect to the data that we measure may affect our understanding of certain details of our business, which could affect our long-term strategies. If our operating metrics are not accurate representations of our business, if investors do not perceive our operating metrics to be accurate, or if we discover material inaccuracies with respect to these figures, we expect that our business, results of operations, financial condition and reputation would be adversely affected.
17
We may require additional debt and equity capital to pursue our business objectives and respond to business opportunities, challenges or unforeseen circumstances. If such capital is not available to us, our business may be harmed.
We may require additional capital to pursue our business objectives and respond to business opportunities, challenges or unforeseen circumstances, including to develop new products or services or further improve existing products and services, expand our geographical footprint, enhance our operating infrastructure, increase our marketing and sales expenditures to improve our brand awareness, and acquire complementary businesses and technologies. Accordingly, we may need to engage in equity or debt financings to secure additional funds. However, additional funds may not be available when we need them, on terms that are acceptable to us, or at all. Moreover, any debt financing that we secure in the future could involve restrictive covenants, which may make it more difficult for us to operate our business, obtain additional capital and to pursue business opportunities. Volatility in the credit markets may also have an adverse effect on our ability to obtain debt financing. If we raise additional funds through further issuances of equity or convertible debt securities, our existing stockholders could suffer significant dilution, and any new equity securities we issue could have rights, preferences and privileges superior to those of holders of our Class A common stock. If we are unable to obtain adequate financing or financing on terms satisfactory to us when we require it, we may be forced to obtain financing on undesirable terms or our ability to continue to pursue our business objectives and to respond to business opportunities, challenges or unforeseen circumstances could be significantly limited, and our business, results of operations and financial condition may be harmed.
Pursuant to the terms of our outstanding indebtedness, we may be limited in our ability to incur future debt.
In August 2021, we entered into a first lien revolving credit facility, or the 2021 Revolver, with JPMorgan Chase Bank, N.A, which provided a $160.0 million senior secured revolving credit facility with a maturity date of August 24, 2026. Our obligations under the 2021 Revolver are secured by substantially all of our assets.
Pursuant to the terms of the credit agreement governing the 2021 Revolver, we are limited in our ability to incur additional indebtedness other than on the terms and conditions thereof. In addition, a failure to comply with the covenants under the 2021 Revolver could result in an event of default by us and an acceleration of amounts due. If an event of default occurs that is not waived by the lenders, and the lenders accelerate any amounts due, we may not be able to make accelerated payments, and the lenders could seek to enforce their security interests in the collateral securing such indebtedness, which could have a material adverse effect on our business and results of operations.
The replacement of LIBOR with the Secured Overnight Financing Rate (SOFR), may adversely affect interest rates.
Certain of our indebtedness is made at variable interest rates that use LIBOR (or metrics derived from or related to LIBOR) as a benchmark for establishing the interest rate of such indebtedness. In 2017, the U.K. Financial Conduct Authority announced that it intends to stop persuading or compelling banks to submit LIBOR rates after 2021. However, the date upon which the LIBOR administrator will cease publication of U.S. dollar LIBOR was deferred to June 30, 2023 for certain tenors (including overnight rates and one, three, six and 12 month rates), although the LIBOR administrator may discontinue or modify LIBOR prior to that date. In addition, the LIBOR administrator has advised that no new contracts using U.S. dollar LIBOR should be entered into after December 31, 2021. On or about June 30, 2023 our indebtedness will transition from LIBOR to the SOFR. SOFR may perform differently than LIBOR, and those differences may be material, particularly in times of economic stress. In addition, the phase out or replacement of LIBOR may cause disruption in, or changes to, financial markets. Such potential disruption or changes in the financial markets could have an adverse effect on our business, financial condition, and liquidity.
Risks Related to Our Business, Our Brand and Our Industry
Our ability to expand our products and services may be limited, which could negatively impact our growth rate, revenue and financial performance.
18
Currently, our platform consists of our digital marketplace, including our auction and value-added services, ACV Capital and ACV Transportation, and Go Green assurance; data services, including our True360 and ACV Market reports and MAX Digital inventory software management offerings; and data and technology, including our inspection software. If we introduce new products and services or expand existing offerings on our platform, we may incur losses or otherwise fail to enter these markets successfully. Our expansion into these markets may place us in competitive and regulatory environments with which we are unfamiliar and involve various risks, including the need to invest significant resources to familiarize ourselves with such frameworks and the possibility that returns on such investments may not be achieved for several years, if at all. In attempting to establish new offerings, we expect to incur significant expenses and face various other challenges, such as expanding our engineering team, sales team and management personnel to cover these markets and complying with complicated regulations that apply to these markets. In addition, we may not successfully demonstrate the value of these value-added products and services to customers, and failure to do so would compromise our ability to successfully expand into these additional revenue streams. Any of these risks, if realized, may harm our business, results of operations and financial condition.
We participate in a highly competitive industry, and pressure from existing and new companies may adversely affect our business, results of operations and financial condition.
We mainly compete with large, national physical vehicle auction companies, such as Manheim, a subsidiary of Cox Enterprises, Inc., Adesa, a subsidiary of Carvana, and KAR Auction Services. The physical vehicle auction market in North America is largely consolidated, with Manheim and Adesa serving as large players in the market. Manheim has expanded into online wholesale marketplaces and auctions, and KAR Auction Services is also competing in the online wholesale auction market. However, we do compete with smaller chains of auctions and independent auctions in the physical market. We also compete with a number of smaller digital marketplace companies.
Our future success also depends on our ability to respond to evolving industry trends, changes in customer requirements and new technologies. If new industry trends take hold, the automotive remarketing industry’s economics could significantly change, and we may need to incur additional costs or otherwise alter our business model to adapt to these changes. Some of our competitors have much greater financial and marketing resources than we have, may be able to respond more quickly to evolving industry dynamics and changes in customer requirements or may be able to devote greater resources to the development, promotion and sale of new or emerging services and technologies. Our ability to successfully grow through investments in the area of emerging opportunities depends on many factors, including advancements in technology, regulatory changes and other factors that are difficult to predict. If we are unable to compete successfully or to successfully adapt to industry changes, our business may be harmed.
Our business is sensitive to changes in the prices of used vehicles.
Any significant changes in retail prices for new or used vehicles could harm our business. For example, if retail prices for used vehicles rise relative to retail prices for new vehicles (as occurred in recent years), it could make buying a new vehicle more attractive to consumers than buying a used vehicle, which could result in reduced used vehicle wholesale sales and adversely impact our business, results of operations and financial condition. Used vehicle prices may affect the volume of vehicles entered for sale in our marketplace and the demand for those used vehicles, the fee revenue per unit, and our ability to retain customers. When used vehicle prices are high (as they have been in recent years), used vehicle dealers may retail more of their trade-in vehicles on their own rather than selling them through our marketplace. Additionally, manufacturer incentives, including financing, could contribute to narrowing the price gap between new and used vehicles.
Our business depends on growing the share of wholesale transactions from existing customers, and the failure to do so would have a material adverse effect on our business, results of operations and financial condition.
19
Our business depends on our ability to grow the share of wholesale transactions from existing customers, increasing the number of wholesale transactions they conduct on our platform. Our customers have no obligation to conduct a minimum number of transactions on our platform or to continue using our platform over time. In order for us to maintain or improve our results of operations, it is important that our customers continue using our platform and increase the share of wholesale transactions which they complete on our platform. We cannot accurately predict whether we will grow the share of wholesale transactions from existing customers. The volume of transactions from existing customers may decline or fluctuate as a result of a number of factors, including business strength or weakness of our customers, customer satisfaction with our platform and other offerings, our fees, the capabilities and fees of our competitors or the effects of global economic conditions. These factors may also be exacerbated if, consistent with our growth strategy, our customer base continues to grow to encompass larger enterprises, which may also require more sophisticated and costly sales efforts. If our customers do not continue to use our digital marketplace or purchase additional services from us, our revenue may decline and our business, results of operations and financial condition may be harmed.
Decreases in the supply of used vehicles coming to the wholesale market may impact sales volumes, which may adversely affect our revenue and profitability.
Decreases in the supply of used vehicles coming to the wholesale market could reduce the number of vehicles sold through our marketplace. The number of new and used vehicles that are purchased or leased by consumers affects the supply of vehicles coming to auction in future periods. For example, an erosion of retail demand for new and used vehicles could cause lenders to reduce originations of new loans and leases, and lead to manufacturing capacity reductions by automakers selling vehicles in the United States. Capacity reductions or supply shortages, including as a result of disruptions to supply chains, could depress the number of vehicles coming to the wholesale market in the future and could lead to reduced numbers of vehicles from various suppliers, negatively impacting auction volumes. If the supply of used vehicles coming to the wholesale market declines, our revenue and profitability may be harmed.
The loss of sellers could adversely affect our business, results of operations and financial condition, and an inability to increase our sources of vehicle supply could adversely affect our growth rates.
Vehicle sellers may cease to use our marketplace in particular markets from time to time, or may choose to sell some of their vehicles through other auction companies with which we compete, which could affect our revenue in the markets in which such sellers are based. There can be no assurance that our existing customers will continue to sell their vehicles through our marketplace. Furthermore, there can be no assurance that we will be able to obtain new vehicle sellers as customers or that we will be able to retain our existing supply of used vehicles. In addition, a failure to increase our sources of vehicle supply could adversely affect our earnings and revenue growth rates.
We may experience seasonal and other fluctuations in our quarterly results of operations, which may not fully reflect the underlying performance of our business.
Our quarterly results of operations, including our revenue, net loss and cash flow have in the past varied, and we expect will in the future vary, significantly based in part on, among other things, vehicle-buying patterns. Vehicle sales typically peak late in the first calendar quarter, with the lowest relative level of industry vehicle sales occurring in the fourth calendar quarter. This seasonality historically corresponds with the timing of income tax refunds, which can provide a primary source of funds for customers’ payments on used vehicle purchases. Used vehicle pricing is also impacted by seasonality, with used vehicles depreciating at a faster rate in the last two quarters of each year and a slower rate in the first two quarters of each year.
Other factors that may cause our quarterly results to fluctuate include, without limitation:
20
In addition, a significant portion of our expenses are fixed and do not vary proportionately with fluctuations in revenue. As a result of these seasonal fluctuations, our results in any quarter may not be indicative of the results we may achieve in any subsequent quarter or for the full year, and period-to-period comparisons of our results of operations may not be meaningful.
Prospective purchasers of vehicles may choose not to shop online, which would prevent us from growing our business.
Our success will depend, in part, on our ability to attract additional customers who have historically purchased vehicles through physical auctions. If we fail to convince potential customers who have historically purchased vehicles entirely or primarily through physical auctions to use our digital marketplace, we may not be able to grow at the rate we expect and our business may suffer. Furthermore, we may have to incur significantly higher and more sustained advertising and promotional expenditures or offer more incentives than we currently anticipate in order to attract additional buyers to our platform and convert them into participants on our online auction marketplace. Specific factors that could prevent participants from transacting on our platform include:
If the online market for vehicles does not continue to develop and grow, our business will not grow and our business, results of operations and financial condition could be materially adversely affected.
Failure to properly and accurately inspect the condition of vehicles sold through our marketplace could harm our business.
We face risks with respect to the condition of vehicles sold through our marketplace. We are engaged to inspect the majority of vehicles sold through our marketplace. We periodically receive complaints from buyers and sellers who believe our inspection reports are not consistent with the condition of the relevant vehicle sold through our marketplace. While our arbitration policy provides that we make no representations or guarantees regarding any vehicles sold through our marketplace, if our inspection reports are found to be inaccurate or otherwise fail to disclose material defects with vehicles, we risk diminished customer confidence in and use of our services. We also commit in some circumstances to covering the cost of undisclosed cosmetic damage. If we fail to disclose cosmetic damages in our inspection reports for a large number of transactions it could adversely affect our business, results of operations, and financial condition. In addition, buyers may be entitled in certain circumstances to cancellation of their purchase, which could reduce the amount of revenue we earn from the relevant sale.
21
In addition, through our Go Green assurance, we offer sellers an assurance with regard to our vehicle inspection services with increased protection from the provisions of our arbitration policy. When a seller elects to use our Go Green program, we are obligated to stand behind the quality of our inspection services and related inspection report. In situations where we conclude that a buyer has made a valid arbitration claim with respect to inadequate or omitted disclosures of defects in an inspection report, we must make the remedy directly to the buyer on the seller’s behalf. If we fail to provide accurate inspection reports for a large number of sellers using our Go Green assurance program, the resulting payment obligations to the buyer may adversely affect our business, results of operations and financial condition. Under the Go Green assurance program, we have the opportunity to relist the vehicle if the original transaction is unwound due to errors in the inspection report. However, the second buyer may only be willing to pay a lower price for the vehicle than the first buyer, and we bear the risk of loss for such resale as well, which may adversely affect our business, results of operations and financial condition.
Failure to deal effectively with fraudulent activities on our platform, could harm our business.
In addition, we face risks with respect to fraudulent activities on our platform, including the sale of illegally-acquired vehicles through our auction marketplace, the unauthorized entry into and use of our platform by persons who do not meet our criteria and standards, and participation of buyers in our auctions who have no intention to pay. For example, we have previously received complaints from a small number of buyers who purchased vehicles which were later determined to have been stolen. In addition, a lawsuit was previously brought against us alleging a conspiracy to set bids on our marketplace from transactions that originated from one seller. See the section titled "Legal Proceedings” for further information regarding this matter. Allegations of fraudulent activity on our auction marketplace, even if untrue, may materially and adversely impact our business, results of operations, financial condition and reputation, as well as our ability to attract new customers and retain current customers.
Although we have implemented measures designed to detect and reduce the occurrence of fraudulent activities on our platform and combat bad customer experiences, there can be no assurance that these measures will be effective in combating fraudulent transactions or improving overall satisfaction among sellers, buyers, and other participants. Additional measures to address fraud could negatively affect the attractiveness of our services to buyers or sellers, resulting in a reduction in the ability to attract new customers or retain current customers. Any actual or alleged future fraudulent activity may damage our reputation, or diminish the value of our brand name, either of which could adversely impact our business, results of operations and financial condition.
If the quality of our customer experience, our reputation or our brand were negatively affected, our business, results of operations and financial condition may be harmed.
Our business model is primarily based on our ability to enable customers to buy and sell used vehicles through our marketplace in a seamless, transparent and hassle-free transaction. If our customers fail to perceive us as a trusted brand with a strong reputation and high standards, or if an event occurs that damages our reputation or our brand, it could adversely affect customer demand and adversely affect our business, results of operations and financial condition. Even the perception of a decrease in the quality of our customer experience or brand could impact results. Our high rate of growth makes maintaining the quality of our customer experience more difficult.
Complaints or negative publicity about our business practices, inspection quality, compliance with applicable laws and regulations, data privacy and security or other aspects of our business, especially on blogs and social media websites, could diminish customer confidence in our platform and adversely affect our brand, irrespective of their validity. The growing use of social media increases the speed with which information and opinions can be shared and thus the speed with which our reputation can be damaged. If we fail to correct or mitigate misinformation or negative information about us, our platform, our customer experience, our brand or any aspect of our business, including information spread through social media or traditional media channels, it may harm our business, results of operations and financial condition.
Unfavorable media coverage could harm our business, results of operations and financial condition.
22
We are the subject of media coverage from time to time. Unfavorable publicity regarding our business model, customer support, technology, product offerings, marketplace changes, marketplace quality, data privacy or security practices or management team could adversely affect our reputation. Such negative publicity could also harm the size of our marketplace and the engagement and loyalty of buyers and sellers that utilize it, which could adversely affect our business, results of operations and financial condition. As our marketplace continues to scale and public awareness increases, any future issues that draw media coverage could have an amplified negative effect on our reputation. In addition, negative publicity related to key dealers or commercial partners that we have partnered with may damage our reputation, even if the publicity is not directly related to us. Any negative publicity that we may receive could diminish confidence in, and the use of, our marketplace, which could adversely affect our business, results of operations and financial condition.
We rely on third-party carriers to transport vehicles throughout the United States and are subject to business risks and costs associated with such carriers and with the transportation industry, many of which are out of our control.
We rely on third-party carriers to transport vehicles sold through our marketplace to our customers. As a result, we are exposed to risks associated with the transportation industry such as weather, traffic patterns, local and federal regulations, vehicular crashes, gasoline prices, driver shortages and lack of reliability of many independent carriers. Our third-party carriers who deliver vehicles to our customers could adversely affect the customer experience if they do not perform to our standards of timeliness and care while handling the vehicles, which may harm our business.
Our future growth and profitability relies on the effectiveness and efficiency of our sales and marketing efforts, and these efforts may not be successful.
We rely on our sales and marketing organization to increase brand visibility among dealers and commercial partners and attract potential customers. Sales and marketing expenses are and will continue to be a significant component of our operating expenses, and there can be no assurance that we will achieve a meaningful return on investment on such expenditures, particularly as we expand our operations into new geographic areas or seek to improve our buyer to seller ratio in existing geographic areas. We continue to evolve our marketing strategies and no assurance can be given that we will be successful in developing effective messages and in achieving efficiency in our sales and marketing expenditures.
Our marketing initiatives aim to drive brand awareness and engagement among dealers and commercial partners in order to position us as the trusted online wholesale marketplace. We acquire new dealers and commercial partners through a variety of marketing channels including digital, such as social media and search engine optimization, direct marketing, such as brand-oriented marketing campaigns, and outbound business development, and we have expanded our in-house marketing significantly in recent years. Future growth and profitability will depend in part on the cost and efficiency of our promotional advertising and marketing programs and related expenditures, including our ability to create greater awareness of our platform and brand name, to appropriately plan for future expenditures and to drive the promotion of our platform. If we are unable to recover our marketing costs through increases in customer traffic and incremental sales, or if our marketing campaigns are not successful or are terminated, our growth may suffer and our business may be harmed.
We bear settlement risk for vehicles sold through our auctions.
We bear settlement risk in connection with sales made through our platform. We settle transactions among buyers and sellers using our marketplace, and as a result, the value of each vehicle sold passes through our balance sheet. Since revenue for vehicles does not include the gross sales proceeds, failure to collect the receivables in full may result in a net loss up to the gross sales proceeds on a per vehicle basis in addition to any expenses incurred to collect the receivables and to provide the services associated with the vehicle. If we are unable to collect payments on a large number of vehicles, the resulting decreased fee revenue and potential loss of gross sales proceeds may adversely affect our business, results of operations and financial condition.
23
We have exposure to credit risk with our dealer borrowers, which could have a negative impact on our business, results of operation and financial condition.
We are subject to credit risk resulting from defaults on payments by our dealer borrowers on our floorplan loans. A weak economic environment, degradations in the value of used vehicles or consumers' financing becoming more expensive could exert pressure on our dealer customers resulting in higher delinquencies, repossessions, and losses for us. There can be no assurances that monitoring of our credit risk as it affects the collectability of loans and our efforts to mitigate credit exposure through underwriting policies and risk-mitigation strategies will be sufficient to prevent a negative impact on our business, results of operations and financial condition.
Acquisitions, strategic investments, partnerships, or alliances could be difficult to identify, pose integration challenges, divert the attention of management, disrupt our business, dilute stockholder value, and adversely affect our business, results of operations and financial condition.
We have in the past and may in the future seek to acquire or invest in businesses, joint ventures, products and platform capabilities, or technologies that we believe could complement or expand our services and platform capabilities, enhance our technical capabilities, or otherwise offer growth opportunities. Any such acquisition or investment may divert the attention of management and cause us to incur various expenses in identifying, investigating and pursuing suitable opportunities, whether or not the transactions are completed, and may result in unforeseen operating difficulties and expenditures. In particular, we may encounter difficulties assimilating or integrating the businesses, technologies, products and platform capabilities, personnel or operations of any acquired companies, particularly if the key personnel of an acquired company choose not to work for us, their software is not easily adapted to work with our platform, or we have difficulty retaining the customers of any acquired business due to changes in ownership, management or otherwise. These transactions may also disrupt our business, divert our resources, and require significant management attention that would otherwise be available for development of our existing business. Any such transactions that we are able to complete may not result in any synergies or other benefits we had expected to achieve, which could result in impairment charges that could be substantial. In addition, we may not be able to find and identify desirable acquisition targets or business opportunities or be successful in entering into an agreement with any particular strategic partner. These transactions could also result in dilutive issuances of equity securities or the incurrence of debt, which could adversely affect our business, results of operations and financial condition. In addition, if the resulting business from such a transaction fails to meet our expectations, our business, results of operations and financial condition may be harmed or we may be exposed to unknown risks or liabilities.
Our insurance may not provide adequate levels of coverage against claims.
We believe that we maintain insurance customary for businesses of our size and type. However, there are types of losses we may incur that cannot be insured against or that we believe are not economically reasonable to insure. Moreover, any loss incurred could exceed policy limits and policy payments made to us may not be made on a timely basis. For example, insurance we maintain against liability claims may not continue to be available on terms acceptable to us and such coverage may not be adequate to cover the types of liabilities actually incurred. A successful claim brought against us, if not fully covered by available insurance coverage, may harm our business.
We depend on key personnel to operate our business, and if we are unable to retain, attract and integrate qualified personnel, our ability to develop and successfully grow our business could be harmed.
24
We believe our success has depended, and continues to depend, on the efforts and talents of our executive officers and other employees. Our future success depends on our continuing ability to attract, develop, motivate and retain highly qualified and skilled executive officers and other employees. Qualified individuals are in high demand, and we may incur significant costs to attract and retain them. In addition, the loss of any of our executive officers or other employees could adversely affect our ability to execute our business plan and strategy, and we may not be able to find adequate replacements on a timely basis, if at all. Our executive officers and other employees are at-will employees, which means they may terminate their employment relationship with us at any time, and their knowledge of our business and industry would be extremely difficult to replace. We may not be able to retain the services of any members of our executive officers or other employees. If we do not succeed in attracting well-qualified executive officers or employees or retaining and motivating existing executive officers or employees, our business may be harmed.
Risks Related to Socioeconomic Factors
Our business is highly sensitive to changes in macroeconomic conditions, and risks related to the larger automotive ecosystem, including customer demand, could reduce auto sales and profitability, which may harm our business, results of operations and financial condition.
Our business is affected by general business and economic conditions. This risk is presently heightened by factors such as the uncertain ongoing economic impact of the fluctuating inflation rates, energy prices, interest rates and other macroeconomic pressures in the U.S. and the global economy, as well as the impact of Russia’s military operations in Ukraine, and ongoing volatility in the global economy, including a global or domestic recession or the fear thereof, that could increase our exposure to several risks. We are dependent on the supply of used vehicles in the wholesale market, and our financial performance depends, in part, on conditions in the automotive industry. During past global economic downturns, there has been an erosion of retail demand for new and used vehicles that, together with other factors such as financial market instability, led many lenders to reduce originations of new loans and leases and led to significant manufacturing capacity reductions by automakers selling vehicles in the United States and Canada. Capacity reductions could depress the number of vehicles that become part of the wholesale market in the future and could lead to reduced numbers of vehicles from various suppliers, negatively impacting our volumes. In addition, weak growth in or declining new vehicle sales negatively impacts used vehicle trade-ins to dealers and wholesale volumes. These factors could adversely affect our revenue and profitability.
In addition, we may experience a decrease in demand for used vehicles from buyers due to factors including the lack of availability of consumer credit and declines in consumer spending and consumer confidence. Adverse credit conditions also affect the ability of dealers to secure financing to purchase used vehicles on the wholesale market, which further negatively affects buyer demand. In addition, a reduction in the number of franchised and independent used car dealers may reduce dealer demand for used vehicles.
Consumer purchases of new and used vehicles may also be adversely affected by economic conditions such as employment levels, wage and salary levels, trends in consumer confidence and spending, reductions in consumer net worth, interest rates, inflation, the availability of consumer credit and taxation policies. Consumer purchases in general may decline during recessions, periods of prolonged declines in the equity markets or housing markets and periods when disposable income and perceptions of consumer wealth are lower. Changes to U.S. federal tax policy may negatively affect consumer spending.
25
In addition, the market for used vehicles may be impacted by the significant, and likely accelerating, changes to the broader automotive industry, which may render our existing or future business model or our auction marketplace and value-added products and services less competitive, unmarketable or obsolete. For example, technology is currently being developed to produce automated, driverless vehicles that could reduce the demand for, or replace, traditional vehicles, including the used vehicles that are sold through our marketplace. Additionally, ride-hailing and ride-sharing services are becoming increasingly popular as a means of transportation and may decrease consumer demand for the used vehicles, particularly as urbanization increases. To the extent retail and rental car company demand for new and used vehicles decreases, negatively impacting our volumes, our business, results of operations and financial condition could be materially and adversely affected.
Dealer consolidations or closures could reduce demand for our products, which may decrease our revenue. In the past, the number of U.S. dealers has declined due to dealership consolidations and closures as a result of varying factors, such as increased competitive pressure from online vehicle retailers and global economic downturns. When dealers consolidate, the services they previously purchased separately are often purchased by the combined entity in a lesser quantity or for a lower aggregate price than before, leading to volume compression and loss of revenue. Further dealership consolidations or closures could reduce the aggregate demand for our platform and value-added products and services. If dealership consolidated and closures occur in the future, our business may be harmed.
Additionally, due to high fragmentation in the dealer industry, a small number of interested parties have significant influence over the industry. These parties include state and national dealership associations, state regulators, car manufacturers, consumer groups, independent dealers, and consolidated dealer groups. If and to the extent these parties believe that dealerships should not enter into or maintain business with us, this belief could become shared by dealerships and we may lose a number of our paying dealers.
Our business is subject to the risk of natural disasters, adverse weather events, global pandemics, and other catastrophic events, and to interruption by man-made problems such as terrorism.
Our business is vulnerable to damage or interruption from earthquakes, fires, floods, power losses, telecommunications failures, terrorist attacks, acts of war, adverse weather events, global pandemics, human errors, infrastructure failures, energy crises and similar events. For example, beginning in March 2020, our customers' operations were initially significantly disrupted in certain jurisdictions as a result of the COVID-19 pandemic, causing a temporary significant decrease in activity on our marketplace. The third-party systems and operations on which we rely are subject to similar risks. For example, we rely on FedEx in order to ship and deliver titles in connection with vehicle sales through our marketplace, and the disruption to FedEx’s service as a result of a natural disaster could have an adverse effect on our business, results of operations and financial conditions. Acts of terrorism could also cause disruptions in our businesses, consumer demand or the economy as a whole. We may not have sufficient protection or recovery plans in some circumstances, such as if a natural disaster affects main transportation routes for the delivery of vehicles. Any such disruptions could negatively affect our ability to run our business, which could have an adverse effect on our business, results of operations and financial condition.
26
Risks Related to Information Technology and Intellectual Property
We may not properly leverage or make the appropriate investment in technology advancements, which could result in the loss of any sustainable competitive advantage in products, services and processes.
Our business is dependent on our data-driven platform. Robust information technology systems, platforms and products are critical to our operating environment, digital online products and competitive position. Understanding technology innovation is necessary to retain our competitive advantage. We may not be successful in developing, acquiring or implementing new data-driven products and services which are competitive and responsive to the needs of our customers. We might lack sufficient resources to continue to make the significant investments in information technology to compete with our competitors. Certain information technology initiatives that management considers important to our long-term success will require capital investment, have significant risks associated with their execution, and could take several years to implement. We may not be able to develop or implement these initiatives in a cost-effective, timely manner or at all. There can be no assurance that others will not acquire similar or superior technologies sooner than we do or that we will acquire technologies on an exclusive basis or at a significant price advantage. If we do not accurately predict, prepare and respond to new kinds of technology innovations, market developments and changing customer needs, our business may be harmed.
If we are unable to adequately address our customers’ increasing reliance on technology or provide a compelling vehicle search experience to customers through both our web and mobile platforms, the number of connections between buying and selling dealers using our marketplace may decline and our business, results of operations and financial condition may be harmed.
As dealers increasingly use technology-based services, including our marketplace and other offerings, our success will depend, in part, on our ability to provide customers with a robust and user-friendly experience on our platform. Given a greater focus on technology in the automotive industry, our future success depends in part on our ability to provide enhanced functionality for dealers who use the web and mobile devices to purchase used vehicles and increase the number of transactions with us that are completed by those dealers. Our ability to provide a compelling user experience, both on the web and through mobile devices, is subject to a number of factors, including:
If use of our web and mobile marketplace is not accepted by the dealer industry, our business may be harmed.
In addition, if we fail to continue to provide a compelling user experience to our customers, the number of connections between buying and selling dealers facilitated through our marketplace could decline, which in turn could lead dealers to stop listing their inventory in our marketplace or cause buyers to look outside our platform for their wholesale purchases. If dealers stop listing their inventory in our marketplace, we may not be able to maintain and grow our customer traffic, which may cause other dealers to stop using our marketplace. This reduction in the number of dealers using our marketplace would likely adversely affect our marketplace and our business, results of operations and financial condition.
27
We rely on third-party technology and information systems to complete critical business functions and such reliance may negatively impact our business.
We rely on third-party technology for certain critical business functions that help us deliver our products and services and operate our business. Our business is dependent on the integrity, security and efficient operation of these systems and technologies. Our systems and operations or those of our third-party vendors and partners could be exposed to damage or interruption from, among other things, fire, natural disaster, power loss, telecommunications failure, unauthorized entry, cyber-attacks, security breaches, acts of terrorism, human error, vandalism or sabotage, financial insolvency, bankruptcy and similar events or incidents. The failure of these systems to perform as designed, the failure to maintain or update these systems as necessary, the failure of these systems to comply with applicable laws, regulations, rules, industry codes of conduct, policies, standards or other obligations, the vulnerability of these systems to security breaches, cyber-attacks or other similar incidents, or the inability to enhance our information technology capabilities, and our inability to find suitable alternatives could disrupt our operations and harm our business.
A significant disruption in service of, or other performance or reliability issues with, our platform could damage our reputation and result in a loss of customers, which could harm our brand or our business.
Our brand, reputation and ability to attract customers depend on the reliable performance of our platform and the supporting systems, technology and infrastructure. We may experience significant interruptions to our systems in the future. Interruptions in these systems, whether due to system failures, programming or configuration errors, bugs, vulnerabilities, computer viruses, physical or electronic break-ins or similar events, could affect the availability of our inventory on our platform and prevent or inhibit the ability of customers to access our platform. Problems with the reliability or security of our systems could harm our reputation, result in a loss of customers and result in additional costs.
Problems faced by our third-party web-hosting providers, including Amazon Web Services and Google Cloud, could inhibit the functionality of our platform. For example, our third-party web-hosting providers could close their facilities without adequate notice or suffer interruptions in service caused by cyber-attacks, natural disasters or other phenomena. Disruption of their services could cause our website to be inoperable and could harm our business. Any financial difficulties, up to and including bankruptcy, faced by our third-party web-hosting providers or any of the service providers with whom they contract may have negative effects on our business, the nature and extent of which are difficult to predict. In addition, if our third-party web-hosting providers are unable to keep up with our growing capacity needs, our business may be harmed.
Any errors, defects, disruptions, or other performance or reliability problems with our platform could interrupt our customers’ access to our inventory and our access to data that drives our operations, which could harm our reputation and have an adverse effect on our business, results of operations and financial condition.
We are subject to stringent and changing data privacy and security laws, regulations, rules, industry code of conduct, policies, standards, and other obligations related to data privacy and security. Our actual or perceived failure to comply with such obligations could lead to adverse consequences.
In the ordinary course of business, we collect, receive, store, generate, use, transfer, disclose, make accessible, protect, secure, dispose of, transmit, share and otherwise process confidential, proprietary and personal information. There are numerous federal, state, local and international laws, regulations, rules, industry codes of conduct, policies and standards regarding data privacy and security, including the processing of personal information and other data. The regulatory framework for data privacy and security is in considerable flux and evolving rapidly. Our obligations related to data privacy and security subject to change and subject to differing interpretations and may be costly to comply with, inconsistent between jurisdictions or conflicting with other rules.
28
In the United States, federal, state, and local governments have enacted numerous data privacy and security laws, regulations and rules, including data breach notification laws, personal information privacy laws, and consumer protection laws. For example, the Telephone Consumer Protection Act imposes specific requirements relating to marketing to individuals using technology such as phones, mobile devices, and text messages. As another example, the California Consumer Privacy Act, as modified by the California Privacy Rights Act (collectively, "CCPA") gives California residents expanded rights to among other things, request disclosure of personal information collected about them and whether the data has been sold to others, request deletion of personal information (subject to certain exceptions), opt out of certain personal information sharing and not be discriminated against for exercising these rights. The CCPA provides civil penalties for violations, as well as a private right of action for certain data breaches. A number of other U.S states have also enacted, or are considering enacting comprehensive data privacy laws that share similarities with the CCPA, with at least four such laws (in Virginia, Colorado, Connecticut and Utah) having taken effect, or scheduled to take effect, in 2023. There is also discussion in Congress of a new federal data privacy and security law to which. we may become subject if it is enacted. The effects of the CCPA, and other similar state or federal laws, are potentially significant and may require us to modify our information processing practices and policies, incur substantial compliance costs and subject us to increased potential liability. Additionally, the U.S. Federal Trade Commission (“FTC”) and states’ Attorneys General have brought enforcement actions and prosecuted certain data breach and other privacy-related cases as unfair and/or deceptive acts or practices under the FTC Act. Further, laws in all 50 U.S. states generally require businesses to provide notice under certain circumstances to consumers whose personal information has been disclosed as a result of a data breach. These laws are not consistent, and compliance in the event of a widespread data breach is difficult and may be costly.
Upon our expansion into international markets, including our operations in France, we and our third-party service providers may be subject to a new range of detailed and complex foreign laws regarding privacy and the processing of personal information and other data, most notably the General Data Protection Act Regulation (“GDPR”). The GDPR, together with national legislation, regulations and guidelines of the European Union member states governing the processing of personal data, impose strict obligations and restrictions on the ability to collect, use, retain, protect, disclose, transfer and otherwise process personal data.
In addition, we and our third-party service providers may be required to comply with operating rules and standards imposed by industry organizations such as the National Automated Clearing House Association and the Payment Card Industry Security Standards Council. Additionally, we are also subject to specific contractual requirements contained in third-party agreements governing our processing of personal information and other data.
Further, we are subject to the terms of our privacy policies, and privacy-related disclosures. Although we endeavor to comply with our public statements and documentation, we may at times fail to do so or be alleged to have failed to do so. Our publication of our privacy policies and other statements that provide promises and assurances about data privacy and security can subject us to potential state and federal action if they are found to be deceptive, unfair or misrepresentative of our actual practices.
While we strive to comply with applicable laws, regulations, rules, industry codes of conduct, policies, standards and other legal or contractual obligations relating to data privacy and security, it is possible that these obligations may be interpreted and applied in new ways or in a manner that is inconsistent from one jurisdiction to another and may conflict with other rules or our practices. Additionally, new laws or regulations could be enacted, further complicating our compliance efforts.
29
Any failure or perceived failure by us or third parties we work with to comply with our policies, disclosures and obligations to customers, industry oversight organizations, or other third parties, or applicable data privacy and security laws, regulations, rules, industry codes of conduct, policies, standards or other legal or contractual obligations, may result in, among other things, governmental or regulatory investigations, enforcement actions, regulatory or other fines, orders requiring that we change our practices, criminal compliance orders, claims for damages by affected individuals or litigation or public statements against us by consumer advocacy groups or others, and could cause customers to lose trust in us. Any of the foregoing could be costly and have an adverse effect on our reputation, business, results of operations and financial condition, including but not limited to: loss of customers; interruptions or stoppages in our business operations; limited ability to develop or commercialize our products; expenditure of time and resources to defend any claim or inquiry; adverse publicity; or revision or restructuring of our operations.
Additionally, if vendors, developers or other third parties that we work with violate applicable laws, regulations, rules, industry codes of conduct, policies, standards and other legal or contractual obligations relating to data privacy or security, such violations may also put personal information or other data, including customers' or vendors' information, at risk and could in turn harm our business. Even if we are not determined to have violated these laws or other obligations, government investigations into these issues typically require the expenditure of significant resources and may generate negative publicity.
Government regulation of the internet and ecommerce is evolving, and unfavorable changes or failure by us to comply with these regulations could harm our business.
We are subject to general business regulations and laws, as well as regulations and laws specifically governing the internet and ecommerce. Existing and future regulations and laws could impede the growth of the internet, ecommerce or mobile commerce. These regulations and laws may involve taxes, tariffs, data privacy and security, anti-spam, pricing, content protection, electronic contracts and communications, mobile communications, consumer protection, information reporting requirements, unencumbered internet access to our platform, the design and operation of websites and internet neutrality. It is not clear how existing laws governing issues such as property ownership, licensing, sales and other taxes, and privacy apply to the internet as the vast majority of these laws were adopted prior to the advent of the internet and do not contemplate or address the unique issues raised by the internet or ecommerce. It is possible that general business regulations and laws, or those specifically governing the internet or ecommerce, may be interpreted and applied in a manner that is inconsistent from one market segment to another and may conflict with other rules or our practices. For example, federal, state and local regulation regarding data privacy and security has become more significant, and laws such as the CCPA and GDPR may increase our costs of compliance. We cannot be sure that our practices have complied, comply or will comply fully with all such laws and regulations. The enactment of new laws and regulations or the interpretation of existing laws and regulations in an unfavorable way may affect the operation of our business, directly or indirectly, which could result in substantial regulatory compliance costs, civil or criminal penalties, including fines, adverse publicity, decreased revenue and increased expenses.
It may be costly for us to comply with any of these laws or regulations, and any failure, or perceived failure, by us to comply with any of these laws or regulations could result in damage to our reputation, a loss in business and proceedings or actions against us by governmental entities or others. Any such proceeding or action could hurt our reputation, force us to spend significant amounts in defense of these proceedings, distract our management, increase our costs of doing business, decrease the use of our sites by customers and suppliers and result in the imposition of monetary liability. We also may be contractually liable to indemnify and hold harmless third parties from the costs or consequences of non-compliance with any such laws or regulations. Adverse legal or regulatory developments could substantially harm our business, our ability to attract new customers may be adversely affected, and we may not be able to maintain or grow our revenue and expand our business as anticipated. Any of the foregoing could have an adverse effect on our business, results of operations and financial condition.
30
Security breaches, cyber-attacks or other similar incidents with respect to our information technology systems, or those of our third-party service providers, could result in adverse consequences, including, but not limited to, a disruption of our business operations; reputational harm; loss of revenue or profits; regulatory investigations or actions; litigation; fines and penalties. If we fail to comply with our commitments, assurances or other obligations regarding data privacy and security, our reputation may be harmed and we may be exposed to liability; loss of business; and other adverse business consequences.
Our platform allows for the storage and transmission of our customers’ proprietary or confidential information, which may include personal information or other information. We may use third-party service providers and subprocessors to help us deliver services, including payment services, to our customers. These vendors may store or process personal information, payment card information, or other information on our behalf.
Security breaches, cyber-attacks and other similar incidents continue to increase, and platforms such as ours may be subject to such incidents. These threats, which are becoming increasingly difficult to detect, are perpetuated by a variety of sources, including traditional computer “hackers,” employees engaging in theft or misuse, organized criminal threat actors, nation-states and nation-state-supported actors. We and our third-party service providers may be subject to a variety of these evolving threats, including but not limited to social-engineering attacks (including through phishing attacks), viruses, denial-of-service attacks (such as credential stuffing), malware installation, server malfunctions, ransomware attacks, supply-chain attacks, software bugs, software or hardware failures, loss of data or other computer assets, adware, telecommunications failures, pandemics, earthquakes, fires, floods, or other similar issues. These threats are becoming increasingly prevalent and severe, and can lead to significant interruptions in our operations, loss of information and income, reputational harm, and diversion of funds. Similarly, supply chain-attacks have increased in frequency and severity and we cannot guarantee that third parties and infrastructure in our supply chain and our third-party partners’ supply chains have not been compromised or that they do not contain exploitable defects or bugs that could result in a breach of or disruption to our information technology systems (including our products/services) or the third-party information technology systems that support us and our services.
While we have security measures in place designed to protect customer information and prevent data loss, security breaches, cyber-attacks and other similar incidents, there can be no assurance that our security measures or those of our third-party service providers that store or otherwise process certain of our and our customers’ information on our behalf will be effective in protecting against unauthorized, unlawful, or accidental acquisition, modification, destruction, loss, alteration, encryption, disclosure of, or access to our confidential information, platform or our customers’ information, including personal information, particularly given that our ability to monitor our third-party service providers’ information security practices is limited. The techniques used to sabotage or to obtain unauthorized, unlawful, or accidental acquisition, modification, destruction, loss, alteration, encryption, disclosure of, or access to our platform, systems, networks or physical facilities in which our information or our customers' information is stored or through which information is transmitted change frequently and often are not identified until they are launched against a target, and we may be unable to implement adequate preventative measures or stop security breaches, cyber-attacks or other similar incidents while they are occurring. The security measures that we have integrated into our platform, systems, networks and physical facilities, which are designed to protect against, detect and minimize security breaches, cyber-attacks and other similar incidents, may not be adequate to prevent or detect service interruption, system failure or data loss. Our platform, systems, networks, and physical facilities could also be breached or information could be otherwise compromised due to employee, contractor or customer error, negligence or malfeasance, if, for example, third parties attempt to fraudulently induce our employees, contractors or our customers to disclose information or user names or passwords, or otherwise compromise the security of our platform, networks, systems and physical facilities. Third parties may also exploit vulnerabilities in, or obtain unauthorized, unlawful, or accidental acquisition, modification, destruction, loss, alteration, encryption, disclosure of, or access to, platforms, systems, networks or physical facilities.
31
We are required to comply with laws, regulations, rules, industry codes of conduct, policies, standards and other obligations that require us to maintain reasonable security measures designed to protect personal information, in our possession, custody, or control. We have legal obligations to notify relevant stakeholders of certain security breaches, cyber-attacks and other similar incidents. Such mandatory disclosures are costly and could lead to adverse consequences. These consequences may include: government enforcement actions (for example, investigations, fines, penalties, audits, and inspections); additional reporting requirements and/or oversight; restrictions on processing information (including personal information); litigation (including class claims); indemnification obligations; negative publicity, which may cause our customers to lose confidence in the effectiveness of our security measures and require us to expend significant capital and other resources to respond to or alleviate problems; interruptions in our operations (including availability of information); financial loss; and other similar harms. Security incidents and attendant consequences may cause customers to stop using our products/services, deter new customers from using our products/services, and negatively impact our ability to grow and operate our business.
Our agreements with certain customers may require us to use industry-standard or reasonable measures to safeguard personal information. A security breach, cyber-attack or other similar incident may cause us to breach our customer contracts. A security breach, cyber-attack or other similar incident could lead to claims by our customers or other relevant stakeholders that we have failed to comply with such obligations. As a result, we could be subject to legal action or our customers could end their relationships with us. Our contracts may not contain limitations of liability, and, even where they do, there can be no assurance that the limitations of liability in our contracts would be enforceable or adequate or would otherwise protect us from liabilities or damages related to a security breach, cyber-attack or other similar incident.
Further, security compromises experienced by our customers with respect to information hosted on our platform, even if caused by the customer’s own misuse or negligence, may require us to make certain to public disclosures, which could harm our reputation, erode customer confidence in the effectiveness of our security measures, negatively impact our ability to attract new customers, or cause existing customers to elect not to use our platform. We may be subject to indemnity demands, regulatory proceedings, audits, penalties or litigation based on our customers’ misuse of our platform with respect to such sensitive information and defending against such litigation and otherwise addressing such matters may be expensive, cause distraction and result in us incurring liability, all of which may harm our business.
Litigation resulting from security breaches, cyber-attacks or other similar incidents may adversely affect our business. Actual or alleged unauthorized access to our or our vendors’ platform, systems, networks, or physical facilities could result in litigation with our customers or other relevant stakeholders. These proceedings could force us to spend money in defense or settlement, divert management’s time and attention, increase our costs of doing business, or adversely affect our reputation. We could be required to fundamentally change our business activities and practices or modify our products and platform capabilities in response to such litigation, which could have an adverse effect on our business. If a security breach, cyber-attack or other similar incident were to occur, and the confidentiality, integrity or availability of personal information was disrupted, we could incur significant liability, or our platform, systems or networks may be perceived as less desirable, which could negatively affect our business and damage our reputation.
While we maintain general liability insurance coverage ,coverage for errors or omissions including cyber, we cannot assure you that such coverage will be adequate or otherwise protect us from liabilities or damages with respect to claims alleging compromises of personal information or that such coverage will continue to be available on acceptable terms or at all. The successful assertion of one or more large claims against us that exceeds our available insurance coverage, or results in changes to our insurance policies (including premium increases or the imposition of large deductible or co-insurance requirements), could have an adverse effect on our business. In addition, we cannot be sure that our existing insurance coverage and coverage for errors and omissions will continue to be available on acceptable terms or that our insurers will not deny coverage as to any future claim.
32
Failure to adequately obtain, maintain, protect, defend and enforce our intellectual property rights, including our technology and confidential information, could harm our business.
The protection of intellectual property, including our brand, technology, confidential information and other proprietary rights, is crucial to the success of our business. We rely on a combination of trademark, trade secret, patent, and copyright law, as well as contractual restrictions, to protect our intellectual property. While it is our policy to protect and defend our rights to our intellectual property, monitoring unauthorized use of our intellectual property is difficult and costly, and we cannot predict whether steps taken by us to protect our intellectual property will be adequate to prevent infringement, misappropriation, dilution or other violations of our intellectual property rights. We also cannot guarantee that any measures we take to protect our intellectual property will offer us any meaningful protection or competitive advantage, or that others will not reverse-engineer our technology or independently develop technology that has the same or similar functionality as our technology. Unauthorized parties may also attempt to access, copy, obtain and use our technology, including to develop competing solutions, and policing unauthorized use of our technology and intellectual property rights may be difficult and may not be effective. Any of our intellectual property rights could be challenged, invalidated, circumvented or narrowed in scope, and any litigation to enforce or defend our intellectual property rights could be costly, divert attention of management and may not ultimately be resolved in our favor. Additionally, uncertainty may result from changes to intellectual property legislation and from interpretations of intellectual property laws by applicable courts and agencies.
As part of our efforts to protect our intellectual property, technology and confidential information, a majority of our employees and consultants have entered into confidentiality and assignment of inventions agreements, and we also require certain third parties to enter into nondisclosure agreements. However, we may fail to enter into such agreements with all applicable parties, and such agreements may also not effectively grant all necessary rights to any inventions that may have been developed by our employees and consultants. In addition, such agreements may not be self-executing, may not effectively prevent misappropriation or unauthorized use or disclosure of our trade secrets, confidential information, intellectual property or technology and may not provide an adequate remedy in the event of unauthorized use or disclosure of our trade secrets, confidential information, intellectual property or technology. Despite our efforts to protect our proprietary rights, unauthorized parties may attempt to copy aspects of our website features, software and functionality or obtain and use information that we consider proprietary. Changes in the law or adverse court rulings may also negatively affect our ability to prevent others from using our technology.
We are currently the registrant of various domain names. The regulation of domain names in the United States is subject to change. Regulatory bodies could establish additional top-level domains, appoint additional domain name registrars or modify the requirements for holding domain names. As a result, we may not be able to acquire or maintain domain names that are important for our business.
While software can, in some cases, be protected under copyright law, we have chosen not to register any copyrights in our proprietary software, and instead, primarily rely on unregistered copyrights to protect our proprietary software. In order to bring a copyright infringement lawsuit in the United States, the copyright must be registered. Accordingly, the remedies and damages available to us for unauthorized use of our software may be limited. Our trade secrets, know-how and other proprietary materials may be revealed to the public or our competitors or independently developed by our competitors and no longer provide protection for the related technology. Enforcing a claim that a third party illegally disclosed or obtained and is using any of our internally developed information or technology may be difficult, expensive and time-consuming, and the outcome is unpredictable. Furthermore, our trade secrets, know-how and other proprietary materials may be revealed to the public or our competitors or independently developed by our competitors and no longer provide protection for the related technology. Any of the foregoing could have an adverse effect on our business, results of operations and financial condition.
33
If we are not able to maintain, enhance and protect our reputation and brand recognition through the maintenance and protection of trademarks, our business will be harmed.
We have certain trademarks that are important to our business, such as the ACV Auctions trademark, the ACV and Auctions logo. If we fail to adequately protect or enforce our rights under these trademarks, we may lose the ability to use those trademarks or to prevent others from using them, which could adversely harm our reputation and our business. While we have secured registration of several of our trademarks in the United States, and are actively seeking additional registrations in the United States and Canada, it is possible that others may assert senior rights to similar trademarks, in the United States and internationally, and seek to prevent our use and registration of our trademarks in certain jurisdictions. Our pending trademark or service mark applications may not result in such marks being registered, and we may not be able to use these trademarks or service marks to commercialize our technologies in the relevant jurisdictions.
Our registered or unregistered trademarks or service marks may be challenged, infringed, circumvented, diluted, declared generic, lapsed or determined to be infringing on or dilutive of other marks. We may not be able to protect our rights in these trademarks and service marks, which we need in order to build name recognition with partners and customers. If we are unable to establish name recognition based on our trademarks and service marks, we may not be able to compete effectively and our brand recognition, reputation, business, results of operations and financial condition may be adversely affected.
Third parties may initiate legal proceedings alleging that we are infringing, misappropriating or otherwise violating their intellectual property rights, the outcome of which would be uncertain and could have a material adverse effect on our business, results of operations and financial condition
Our commercial success depends on our ability to develop and commercialize our products and services and use our internally developed technology without infringing the intellectual property or proprietary rights of third parties. Intellectual property disputes can be costly to defend and may cause our business, result of operations and financial condition to suffer. Whether merited or not, we, our partners or parties indemnified by us may face claims of infringement, misappropriation or other violation of third-party intellectual property that could interfere with our ability to market, promote and sell our brands, products and services. Such claims may be made by competitors seeking to obtain a competitive advantage or by other parties. Additionally, in recent years, individuals and groups have begun purchasing intellectual property assets for the purpose of making such claims and attempting to extract settlements from companies like ours. It may be necessary for us to initiate litigation to defend ourselves in order to determine the scope, enforceability, validity or ownership of third-party intellectual property or proprietary rights, or to establish our respective rights. We may not be able to successfully settle or otherwise resolve such adversarial proceedings or litigation. If we are unable to successfully settle future claims on terms acceptable to us, we may be required to engage in or to continue claims, regardless of whether such claims have merit, that can be time-consuming, divert management’s attention and financial resources and be costly to evaluate and defend. The result of any such litigation is difficult to predict and may require us to stop commercializing or using our technology, obtain licenses, modify our platform, services and technology while we develop non-infringing substitutes or incur substantial damages, settlement costs or face a temporary or permanent injunction prohibiting us from marketing or providing the affected products and services. If we require a third-party license, it may not be available on reasonable terms or at all, and we may have to pay substantial royalties and upfront or ongoing fees, or grant cross-licenses to our own intellectual property rights. Such licenses may also be non-exclusive, which could allow competitors and other parties to use the subject technology in competition with us. We may also have to redesign our platform, services and technology so they do not infringe, misappropriate or otherwise violate third-party intellectual property rights, which may not be possible or may require substantial monetary expenditures and time, during which our technology may not be available for commercialization or use. Even if we have an agreement to indemnify us against such costs, the indemnifying party may be unable to uphold its contractual obligations. If we cannot or do not obtain a third-party license to the infringed technology at all, license the technology on reasonable terms or obtain similar technology from another source, our revenue and earnings could be adversely impacted.
34
From time to time, we may be subject to legal proceedings and claims in the ordinary course of business with respect to intellectual property. Some third parties may be able to sustain the costs of complex litigation more effectively than we can because they have substantially greater resources. Even if resolved in our favor, litigation or other legal proceedings relating to intellectual property claims may cause us to incur significant expenses, and could distract our technical and management personnel from their normal responsibilities. In addition, there could be public announcements of the results of hearings, motions or other interim proceedings or developments, and if securities analysts or investors perceive these results to be negative, it could have a material adverse effect on the price of our Class A common stock. Moreover, any uncertainties resulting from the initiation and continuation of any legal proceedings could have a material adverse effect on our ability to raise the funds necessary to continue our operations. Any of the foregoing could have a material adverse effect on our business, results of operations and financial condition.
We may be subject to claims asserting that our employees, consultants or advisors have wrongfully used or disclosed alleged trade secrets of their current or former employers or claims asserting ownership of what we regard as our own intellectual property.
Although we try to ensure that our employees, consultants and advisors do not use the proprietary information or know-how of others in their work for us, we may be subject to claims that we or these individuals have used or disclosed intellectual property, including trade secrets or other proprietary information, of any such individual’s current or former employer. Litigation may be necessary to defend against these claims. If we fail in defending any such claims, in addition to paying monetary damages, we may lose valuable intellectual property rights or personnel. Even if we are successful in defending against such claims, litigation could result in substantial costs and be a distraction to management.
In addition, while it is our policy to require our employees and contractors who may be involved in the creation or development of intellectual property on our behalf to execute agreements assigning such intellectual property to us, we may be unsuccessful in having all such employees and contractors execute such an agreement. The assignment of intellectual property may not be self-executing or the assignment agreement may be breached, and we may be forced to bring claims against third parties or defend claims that they may bring against us to determine the ownership of what we regard as our intellectual property. Any of the foregoing could have a material adverse effect on our business, results of operations and financial condition.
Our use of “open source” software could adversely affect our ability to offer our products and services and subject us to possible litigation.
We use open source software in connection with our products and services. Companies that incorporate open source software into their technologies have, from time to time, faced claims challenging the use of open source software, the ownership of software that such companies believed to be open source and/or compliance with open source license terms. As a result, we could be subject to suits by parties claiming ownership of what we believe to be open source software or claiming noncompliance with open source licensing terms. Some open source software licenses require users who distribute or make available across a network software and services that include open source software to publicly disclose all or part of the source code to such software and/or make available any derivative works of the open source code, which could include valuable proprietary code, on unfavorable terms or at no cost. While we monitor the use of open source software and try to ensure that none is used in a manner that would require us to disclose our internally developed source code, including that of our platform, or that would otherwise breach the terms of an open source agreement, such use could inadvertently occur, in part because open source license terms are often ambiguous and may not have been tested in a court of law, resulting in a dearth of guidance regarding the proper legal interpretation of such licenses. In addition to risks related to license requirements, use of certain open source software can lead to greater risks than use of third-party commercial software, as open source licensors generally do not provide warranties or controls on the origin of software which, thus, may contain security vulnerabilities or infringing or broken code. Use of open source software may also present additional security risks because the public availability of such software may make it easier for hackers and other third parties to determine how to compromise our platform. Any of the foregoing, including a requirement to publicly disclose our internally developed source code or pay damages for breach of contract, could have a material adverse effect on our business, results of operations and financial condition and could help our competitors develop services that are similar to or better than ours.
35
We rely on third-party providers to perform payment-related services on our behalf, and the failure of such third-parties to adequately perform such services or comply with applicable laws could harm our business.
We rely on third-party service providers to perform services related to payment processing, identity verification and fraud analysis and detection. As a result, we are subject to a number of risks related to our dependence on third-party service providers. If any or some of these service providers fail to perform adequately or if any such service provider were to terminate or modify its relationship with us unexpectedly, it could negatively impact our buyers’ ability to pay for some services, drive customers away from our services, result in potential legal liability or heightened risk, and harm our business. In addition, we and our third-party service providers may experience service outages from time to time that could adversely impact payments made on our platform. Additionally, any unexpected termination or modification of those third-party services could lead to a lapse in the effectiveness of certain fraud prevention and detection tools.
Our third-party service providers may increase the fees they charge us in the future, which would increase our operating expenses. This could, in turn, require us to increase the fees we charge to customers and cause some customers to reduce their use of our marketplace or to leave our platform altogether.
Payments are governed by complex and continuously evolving laws and regulations that are subject to change and vary across different jurisdictions in the United States. Any failure or claim of failure on our part or the part of our third-party service providers to comply with applicable laws and regulations relating to payments could require us to expend significant resources, result in liabilities, limit or preclude our ability to enter certain markets and harm our reputation.
Risks Related to Government Regulation and Litigation
We operate in highly regulated industries and either are or may be subject to a wide range of federal, state and local laws and regulations and our failure to comply with these laws and regulations may force us to change our operations or harm our business.
The industry in which we operate is and will continue to be subject to extensive U.S. federal, state, local and international laws and regulations. The wholesale, financing and transportation of used vehicles are regulated by the states in which we operate and by the U.S. federal government. These laws can vary significantly from state to state. In addition, we are subject to regulations and laws specifically governing the internet and ecommerce and the collection, storage, processing, transfer and other use of personal information and other customer data. We are also subject to federal and state laws, such as the Equal Credit Opportunity Act and prohibitions against unfair or deceptive acts or practices. The federal governmental agencies that regulate our business and have the authority to enforce such regulations and laws against us include the FTC, the U.S. Department of Transportation, the U.S. Occupational Health and Safety Administration, the U.S. Department of Justice, the U.S. Federal Communications Commission and the U.S. Equal Employment Opportunity Commission. We are subject to regulation by individual state financial regulatory agencies. We also are subject to audit by such state regulatory authorities. Additionally, we may be subject to regulation by individual state dealer licensing authorities and state consumer protection agencies.
The wholesale sale of used vehicles through our platform and financing offerings may be subject to state and local licensing requirements. Despite our belief that we are not subject to the licensing requirements of such jurisdictions, regulators of jurisdictions in which our customers reside for which we do not have a dealer or financing license could require that we obtain a license or otherwise comply with various state regulations. Regulators may seek to impose punitive fines for operating without a license or demand we seek a license in those jurisdictions, any of which may inhibit our ability to do business in those jurisdictions, increase our operating expenses and adversely affect our business, results of operations and financial condition.
In addition to these laws and regulations, our facilities and business operations are subject to a wide array of federal, state and local laws and regulations relating to occupational health and safety, and other broadly applicable business regulations. We also are subject to laws and regulations involving taxes, privacy and data security, anti-spam, content protection, electronic contracts and communications, mobile communications, unencumbered internet access to our platform, the design and operation of websites and internet neutrality.
36
We are subject to laws and regulations affecting public companies, including securities laws and exchange listing rules. The violation of any of these laws or regulations could result in administrative, civil or criminal penalties or in a cease-and-desist order against our business operations, any of which could damage our reputation and adversely affect our business. We have incurred and will continue to incur capital and operating expenses and other costs to comply with these laws and regulations.
The foregoing description of laws and regulations to which we are or may be subject is not exhaustive, and the regulatory framework governing our operations is subject to evolving interpretations and continuous change. Moreover, if we expand into additional jurisdictions, we will be subject to an increased variety of new and complex laws and regulations.
We are, and may in the future be, subject to legal proceedings in the ordinary course of our business. If the outcomes of these proceedings are adverse to us, it could have an adverse effect on our business.
We are subject to various litigation matters from time to time, the outcomes of which could harm our business. Claims arising out of actual or alleged violations of law could be asserted against us by individuals, either individually or through class actions, by governmental entities in civil or criminal investigations and proceedings or by other entities. These claims could be asserted under a variety of laws, including but not limited to intellectual property laws, data privacy and security laws, labor and employment laws, securities laws and employee benefit laws. These actions could expose us to adverse publicity and to substantial monetary damages and legal defense costs, injunctive relief and criminal and civil fines and penalties, including but not limited to suspension or revocation of licenses to conduct business. Furthermore, defending ourselves against these claims may require us to expend substantial financial resources and divert management’s attention, which could adversely impact our business, results of operations and financial condition. See the section titled “Legal Proceedings” for more information.
We may be limited in our ability to utilize, or may not be able to utilize, net operating loss carryforwards to reduce our future tax liability.
Our net operating loss carryforwards, or NOLs, and certain other tax attributes could expire unused and be unavailable to offset future income tax liabilities because of their limited duration or because of restrictions under U.S. tax law. Our U.S. Federal NOLs generated in tax years beginning before January 1, 2018 are only permitted to be carried forward for 20 taxable years under applicable U.S. federal tax law. As of December 31, 2022, we had U.S. federal and state NOLs of $299.8 million and $241.2 million, respectively. Of the U.S. federal NOLs, $12.3 million will expire beginning in the year 2035 and $287.5 million will carry forward indefinitely.
Under the Tax Cuts and Jobs Act, or the Tax Act, as modified by the Coronavirus Aid, Relief, and Economic Security Act, or the CARES Act, U.S NOLs arising in tax years beginning after December 31, 2017 may be carried forward indefinitely, but the deductibility of such U.S federal NOLs, particularly for tax years beginning after December 31, 2020, may be limited. Across the states, various NOL deduction limitations and carryforward periods are applicable based on state conformity to the Internal Revenue Code and state specific rules related to NOL carryforward periods and usage.
In addition, our NOLs and tax credit carryforwards are subject to limitations under the Internal Revenue Code of 1986, as amended, or the Code, and similar state tax laws as well as review and possible adjustment by the Internal Revenue Service and state tax authorities. Under Sections 382 and 383 of the Code, if a corporation undergoes an “ownership change” (generally defined as a cumulative change in the corporation’s ownership by “5-percent stockholders” that exceeds 50 percentage points over a rolling three-year period), the corporation’s ability to use its pre-change NOLs and certain other pre-change tax attributes to offset its post-change income and taxes may be limited. Similar rules may apply under state tax laws. We have not determined whether any such limitations apply to our business. If our ability to utilize those NOLs and tax credit carryforwards becomes limited by an “ownership change” as described above, it may not be able to utilize a material portion of our NOLs and certain other tax attributes, which could adversely affect our cash flows and results of operations.
37
Risks Related to Being a Public Company
We will continue to incur increased costs as a result of operating as a public company, and our management will be required to continue to devote substantial time to compliance with our public company responsibilities and corporate governance practices.
As a public company, we have incurred and will continue to incur significant finance, legal, accounting and other expenses, including director and officer liability insurance, that we did not incur as a private company, which we expect to further increase as we are no longer an “emerging growth company” as defined in the Jumpstart Our Business Startups Act, or JOBS Act. The Sarbanes-Oxley Act, the Dodd-Frank Wall Street Reform and Consumer Protection Act, the listing requirements of The Nasdaq Stock Market, and other applicable securities rules and regulations impose various requirements on public companies. Our management and other personnel devote a substantial amount of time to compliance with these requirements. Moreover, these rules and regulations will increase our legal and financial compliance costs and will make some activities more time-consuming and costly. We cannot predict or estimate the amount of additional costs we will incur as a public company or the specific timing of such costs.
We are obligated to develop and maintain proper and effective internal controls over financial reporting, and any failure to maintain the adequacy of these internal controls may adversely affect investor confidence in our company and, as a result, the value of our Class A common stock.
We are required, pursuant to Section 404 of the Sarbanes-Oxley Act, or Section 404, to furnish a report by management on, among other things, the effectiveness of our internal control over financial reporting beginning with this Annual Report on Form 10-K and on an annual basis thereafter. This assessment requires disclosure of any material weaknesses identified by our management in our internal control over financial reporting. In addition, because the market value of our Class A common stock held by non-affiliates exceeded $700 million as of June 30, 2022, we are deemed a “large accelerated filer” under the Exchange Act and have lost our status as an emerging growth company as of December 31, 2022. As a result, our independent registered public accounting firm is required to attest to the effectiveness of our internal control over financial reporting beginning with this Annual Report on Form 10-K and on an annual basis thereafter. We have been engaged in the costly and challenging process of compiling the system and processing documentation necessary to perform the evaluation needed to comply with Section 404, and our continued compliance with Section 404 will require that we incur substantial expenses and expend significant management efforts.
During the evaluation and testing process of our internal controls in future years, if we identify one or more material weaknesses in our internal control over financial reporting, we will be unable to certify that our internal control over financial reporting is effective.
If material weaknesses or control deficiencies occur in the future, we may be unable to report our financial results accurately on a timely basis or help prevent fraud, which could cause our reported financial results to be materially misstated and result in the loss of investor confidence or delisting and cause the market price of our common stock to decline. If we have material weaknesses in the future, it could affect the financial results that we report or create a perception that those financial results do not fairly state our results of operations or financial condition. Either of those events could have an adverse effect on the value of our common stock.
Further, even if we conclude that our internal control over financial reporting provides reasonable assurance regarding the reliability of financial reporting and the preparation of financial statements for external purposes in accordance with Generally Accepted Accounting Principles (GAAP), because of its inherent limitations, internal control over financial reporting may not prevent or detect fraud or misstatements. Failure to implement required new or improved controls, or difficulties encountered in their implementation, could harm our results of operations or cause us to fail to meet our future reporting obligations.
38
Risks Related to Ownership of Our Class A Common Stock
The dual class structure of our common stock has the effect of concentrating voting control with our executive officers, directors and their affiliates, which will limit the ability of holders of our Class A common stock to influence the outcome of important decisions.
Our Class B common stock has ten votes per share and our Class A common stock has one vote per share. As a result, as of December 31, 2022, holders of our Class B common stock, collectively own shares representing approximately 75.0% of the voting power of our outstanding capital stock with our directors, their affiliates, and our executive officers owning the majority of Class B common stock. As a result, the holders of our Class B common stock will be able to exercise considerable influence over matters requiring stockholder approval, including the election of directors and approval of significant corporate transactions, such as a merger or other sale of our company or our assets, even if their stock holdings represent less than 50% of the aggregate outstanding shares of our capital stock. This concentration of ownership will limit the ability of other stockholders to influence corporate matters and may cause us to make strategic decisions that could involve risks to holders of our Class A common stock or that may not be aligned the interests of holders of our Class A common stock. This control may adversely affect the market price of our Class A common stock.
Further, future transfers by holders of our Class B common stock will generally result in those shares converting into shares of our Class A common stock, subject to limited exceptions, such as certain transfers effected for tax or estate planning purposes. The conversion of shares of our Class B common stock into shares of our Class A common stock will have the effect, over time, of increasing the relative voting power of those holders of Class B common stock who retain their shares in the long term.
We cannot predict the impact our dual class structure may have on the market price of our Class A common stock.
We cannot predict whether our dual class structure, combined with the concentrated control of our stockholders who held our capital stock prior to the completion of our IPO, including our executive officers, employees and directors and their affiliates, will result in a lower or more volatile market price of our Class A common stock or in adverse publicity or other adverse consequences. For example, certain index providers have announced restrictions on including companies with multiple class share structures in certain of their indexes. In July 2017, FTSE Russell and Standard & Poor’s announced that they would cease to allow most newly public companies utilizing dual or multi-class capital structures to be included in their indices. Under the announced policies, our dual class capital structure would make us ineligible for inclusion in any of these indices. Given the sustained flow of investment funds into passive strategies that seek to track certain indexes, exclusion from stock indexes would likely preclude investment by many of these funds and could make our Class A common stock less attractive to other investors. As a result, the market price of our Class A common stock could be adversely affected.
Our stock price may be volatile, and the value of our Class A common stock may decline.
The market price of our Class A common stock may be highly volatile and may fluctuate or decline substantially as a result of a variety of factors, some of which are beyond our control, including:
39
Broad market and industry fluctuations, as well as general economic, political, regulatory, and market conditions, may also negatively impact the market price of our Class A common stock.
Sales of our Class A common stock in the public market could cause the market price of our Class A common stock to decline.
Sales of a substantial number of shares of our Class A common stock in the public market, or the perception that these sales might occur, could depress the market price of our Class A common stock and could impair our ability to raise capital through the sale of additional equity securities. Many of our stockholders who held our capital stock prior to the completion of our IPO have substantial unrecognized gains on the value of the equity they hold based upon the price at which shares were sold in our IPO, and therefore they may take steps to sell their shares or otherwise secure the unrecognized gains on those shares. We are unable to predict the timing of or the effect that such sales may have on the prevailing market price of our Class A common stock.
In addition, there were 6,489,417 shares of Class B common stock issuable upon the exercise of options as of December 31, 2022. There were also 1,296,186 shares of Class B common stock and 4,682,378 shares of Class A common stock issuable upon the vesting of restricted stock units, or RSUs, outstanding as of December 31, 2022. We have registered all of the shares of Class A common stock and Class B common stock issuable upon exercise or vesting of outstanding options or RSUs, respectively, or other equity incentives we may grant in the future, for public resale under the Securities Act. The shares of Class A common stock will become eligible for sale in the public market to the extent such options are exercised, subject to compliance with applicable securities laws.
Further, based on shares outstanding as of December 31, 2022, holders of a significant percentage of our capital stock, had rights, subject to some conditions, to require us to file registration statements covering the sale of their shares or to include their shares in registration statements that we may file for ourselves or other stockholders.
Our issuance of additional capital stock in connection with financings, acquisitions, investments, our equity incentive plans or otherwise will dilute all other stockholders.
We expect to issue additional capital stock in the future that will result in dilution to all other stockholders. We expect to grant equity awards to employees, directors and consultants under our equity incentive plans. We may also raise capital through equity financings in the future. As part of our business strategy, we may acquire or make investments in companies and issue equity securities to pay for any such acquisition or investment. Any such issuances of additional capital stock may cause stockholders to experience significant dilution of their ownership interests and the per share value of our Class A common stock to decline.
If securities or industry analysts do not publish research or publish unfavorable or inaccurate research about our business, the market price and trading volume of our Class A common stock could decline.
40
The market price and trading volume of our Class A common stock will be heavily influenced by the way analysts interpret our financial information and other disclosures. We do not have control over these analysts. If few securities analysts commence coverage of us, or if industry analysts cease coverage of us, our stock price would be negatively affected. If securities or industry analysts do not publish research or reports about our business, downgrade our Class A common stock, or publish negative reports about our business, our stock price would likely decline. If one or more of these analysts cease coverage of us or fail to publish reports on us regularly, demand for our Class A common stock could decrease, which might cause our stock price to decline and could decrease the trading volume of our Class A common stock.
We do not intend to pay dividends for the foreseeable future.
While we have previously paid cash dividends on our capital stock, we do not intend to pay any cash dividends in the foreseeable future. Any determination to pay dividends in the future will be at the discretion of our board of directors. In addition, our ability to pay dividends on our capital stock is currently limited by the covenants of our credit facilities and may be further restricted by the terms of any future debt or preferred securities. Accordingly, holders of our Class A common stock may need to rely on sales of their holdings of Class A common stock after price appreciation, which may never occur, as the only way to realize any future gains on their investment.
Anti-takeover provisions in our charter documents and under Delaware law could make an acquisition of our company more difficult, limit attempts by our stockholders to replace or remove our current management and limit the market price of our Class A common stock.
Provisions in our amended and restated certificate of incorporation and amended and restated bylaws may have the effect of delaying or preventing a change of control or changes in our management. Our amended and restated certificate of incorporation and amended and restated bylaws include provisions that:
41
These provisions may frustrate or prevent any attempts by our stockholders to replace or remove our current management by making it more difficult for stockholders to replace members of our board of directors, which is responsible for appointing the members of our management. In addition, because we are incorporated in Delaware, we are governed by the provisions of Section 203 of the Delaware General Corporation Law, which generally, subject to certain exceptions, prohibits a Delaware corporation from engaging in any of a broad range of business combinations with any “interested” stockholder for a period of three years following the date on which the stockholder became an “interested” stockholder. Any of the foregoing provisions could limit the price that investors might be willing to pay in the future for shares of our Class A common stock, and they could deter potential acquirers of our company, thereby reducing the likelihood that holders of our Class A common stock would receive a premium for their shares of our Class A common stock in an acquisition.
Our amended and restated certificate of incorporation provides that the Court of Chancery of the State of Delaware and the federal district courts of the United States of America will be the exclusive forums for substantially all disputes between us and our stockholders, which could limit our stockholders’ ability to obtain a favorable judicial forum for disputes with us or our directors, officers, or employees.
Our amended and restated certificate of incorporation provides that the Court of Chancery of the State of Delaware is the exclusive forum for the following types of actions or proceedings under Delaware statutory or common law:
The provisions would not apply to suits brought to enforce a duty or liability created by the Exchange Act. Furthermore, Section 22 of the Securities Act creates concurrent jurisdiction for federal and state courts over all such Securities Act actions. Accordingly, both state and federal courts have jurisdiction to entertain such claims. To prevent having to litigate claims in multiple jurisdictions and the threat of inconsistent or contrary rulings by different courts, among other considerations, our amended and restated certificate of incorporation further provides that the federal district courts of the United States of America will be the exclusive forum for resolving any complaint asserting a cause or causes of action arising under the Securities Act, including all causes of action asserted against any defendant to such complaint. For the avoidance of doubt, this provision is intended to benefit and may be enforced by us, our officers and directors, the underwriters to any offering giving rise to such complaint, and any other professional entity whose profession gives authority to a statement made by that person or entity and who has prepared or certified any part of the documents underlying the offering.
While the Delaware courts have determined that such choice of forum provisions are facially valid, a stockholder may nevertheless seek to bring a claim in a venue other than those designated in the exclusive forum provisions. In such instance, we would expect to vigorously assert the validity and enforceability of the exclusive forum provisions of our amended and restated certificate of incorporation. This may require significant additional costs associated with resolving such action in other jurisdictions and there can be no assurance that the provisions will be enforced by a court in those other jurisdictions.
These exclusive forum provisions may limit a stockholder’s ability to bring a claim in a judicial forum that it finds favorable for disputes with us or our directors, officers, or other employees, which may discourage lawsuits against us and our directors, officers and other employees. If a court were to find either exclusive-forum provision in our amended and restated certificate of incorporation to be inapplicable or unenforceable in an action, we may incur further significant additional costs associated with resolving the dispute in other jurisdictions, all of which could seriously harm our business.
42
Item 1B. Unresolved Staff Comments.
None.
Item 2. Properties.
We lease our corporate headquarters located at 640 Ellicott Street, Buffalo, New York, where we occupy approximately 25,000 square feet of office space pursuant to a lease that expires in July 2023, with an option to extend this lease for a successive period of five years. We have other offices in New York, Connecticut, Florida, Illinois, Ohio, and Canada occupying over 62,000 square feet, which are also leased. We do not own any real property.
We believe that our current facilities are suitable and adequate to meet our current needs, and if we require additional space, we anticipate we will be able to obtain additional suitable facilities.
Item 3. Legal Proceedings.
From time to time we may become involved in legal proceedings or be subject to claims arising in the ordinary course of our business. Other than with respect to the matter described below, we are not presently subject to any pending or threatened litigation that we believe, if determined adversely to us, would individually, or taken together, would reasonably be expected to have a material adverse effect on our business or financial results.
On March 19, 2021, a putative class action was filed against ACV Auctions, Inc., et al. in the U.S. District Court for the Western District of New York (the "Court"), alleging violations of the federal antitrust laws and New York State law related to an alleged conspiracy to set bids on our marketplace from transactions that originated from one seller. The complaint seeks statutory damages under such laws and other relief. In July 2021, the complaint was amended to add and modify allegations beyond the initial complaint, as well as to add certain individuals as individual defendants, including George Chamoun, our Chief Executive Officer. In January 2022, the Court heard arguments on the motion to dismiss that the defendants had previously filed and dismissed the federal claims with leave for the plaintiff to amend their complaint. In the fourth quarter of 2022, the Company recorded a liability for litigation matters in anticipation of the settlement. As of January 31, 2023, the complaint has been settled and dismissed by the court.
Item 4. Mine Safety Disclosures.
Not applicable.
43
PART II
Item 5. Market for Registrant’s Common Equity, Related Stockholder Matters and Issuer Purchases of Equity Securities.
Market Information and Holders of Record
Our Class A common stock is traded on The Nasdaq Global Select Market, under the symbol ""ACVA. Our Class B common stock is not listed or traded on any exchange, but each share of Class B common stock is convertible at any time at the option of the holder into one share of Class A common stock, and is automatically converted upon sale or transfer of one share of Class A common stock.
As of February 21, 2023, there were 46 holders of record of our Class A common stock and 63 holders of record of our Class B common stock. Certain shares are held in street name and accordingly, the
actual number of holders of record is not known or included in the foregoing number. This number of holders of record also does not include stockholders
whose shares may be held in trust by other entities.
Dividend Policy
We have never declared or paid any dividends on our Class A common stock or Class B common stock. We currently intend to retain all available funds and any future earnings for the operation and expansion of our business. Accordingly, we do not anticipate declaring or paying dividends in the foreseeable future. The payment of any future dividends will be at the discretion of our Board of Directors and will depend on our results of operations, capital requirements, financial condition, prospects, contractual arrangements (including any restrictions in our debt arrangements), any limitations on payment of dividends present in any debt agreements, and other factors that our Board of Directors may deem relevant.
Use of Proceeds
The Registration Statement on Form S-1 (File No. 333-253617), for our initial public offering (the "IPO") was declared effective by the SEC on March 23, 2021. There has been no material change in the planned use of proceeds from the IPO from that described in the prospectus filed with the SEC pursuant to Rule 424(b)(4) under the Securities Act on March 24, 2021.
Recent Sales of Unregistered Securities
On February 22, 2022, we issued 620,877 shares of Class A common stock in connection with an acquisition, which are held in escrow. The issuance was deemed exempt from registration under the Securities Act pursuant to the exemption provided by Section 4(a)(2) of the Securities Act as a transaction by an issuer not involving a public offering.
Issuer Purchases of Equity Securities
None.
Stock Performance Graph
The graph below shows a comparison, from March 24, 2021 (the date our Class A common stock commenced trading on Nasdaq) through December 31, 2022, of the cumulative total return to stockholders of our Class A common stock relative to the Nasdaq Composite Index and the Nasdaq-100 Technology Sector Index.
The graph assumes that $100 was invested in each of our Class A common stock, the Nasdaq Composite Index and the Nasdaq-100 Technology Sector Index at their respective closing prices on March 24, 2021. The stock performance shown in the graph represents past performance and should not be considered an indication of future stock performance.
44
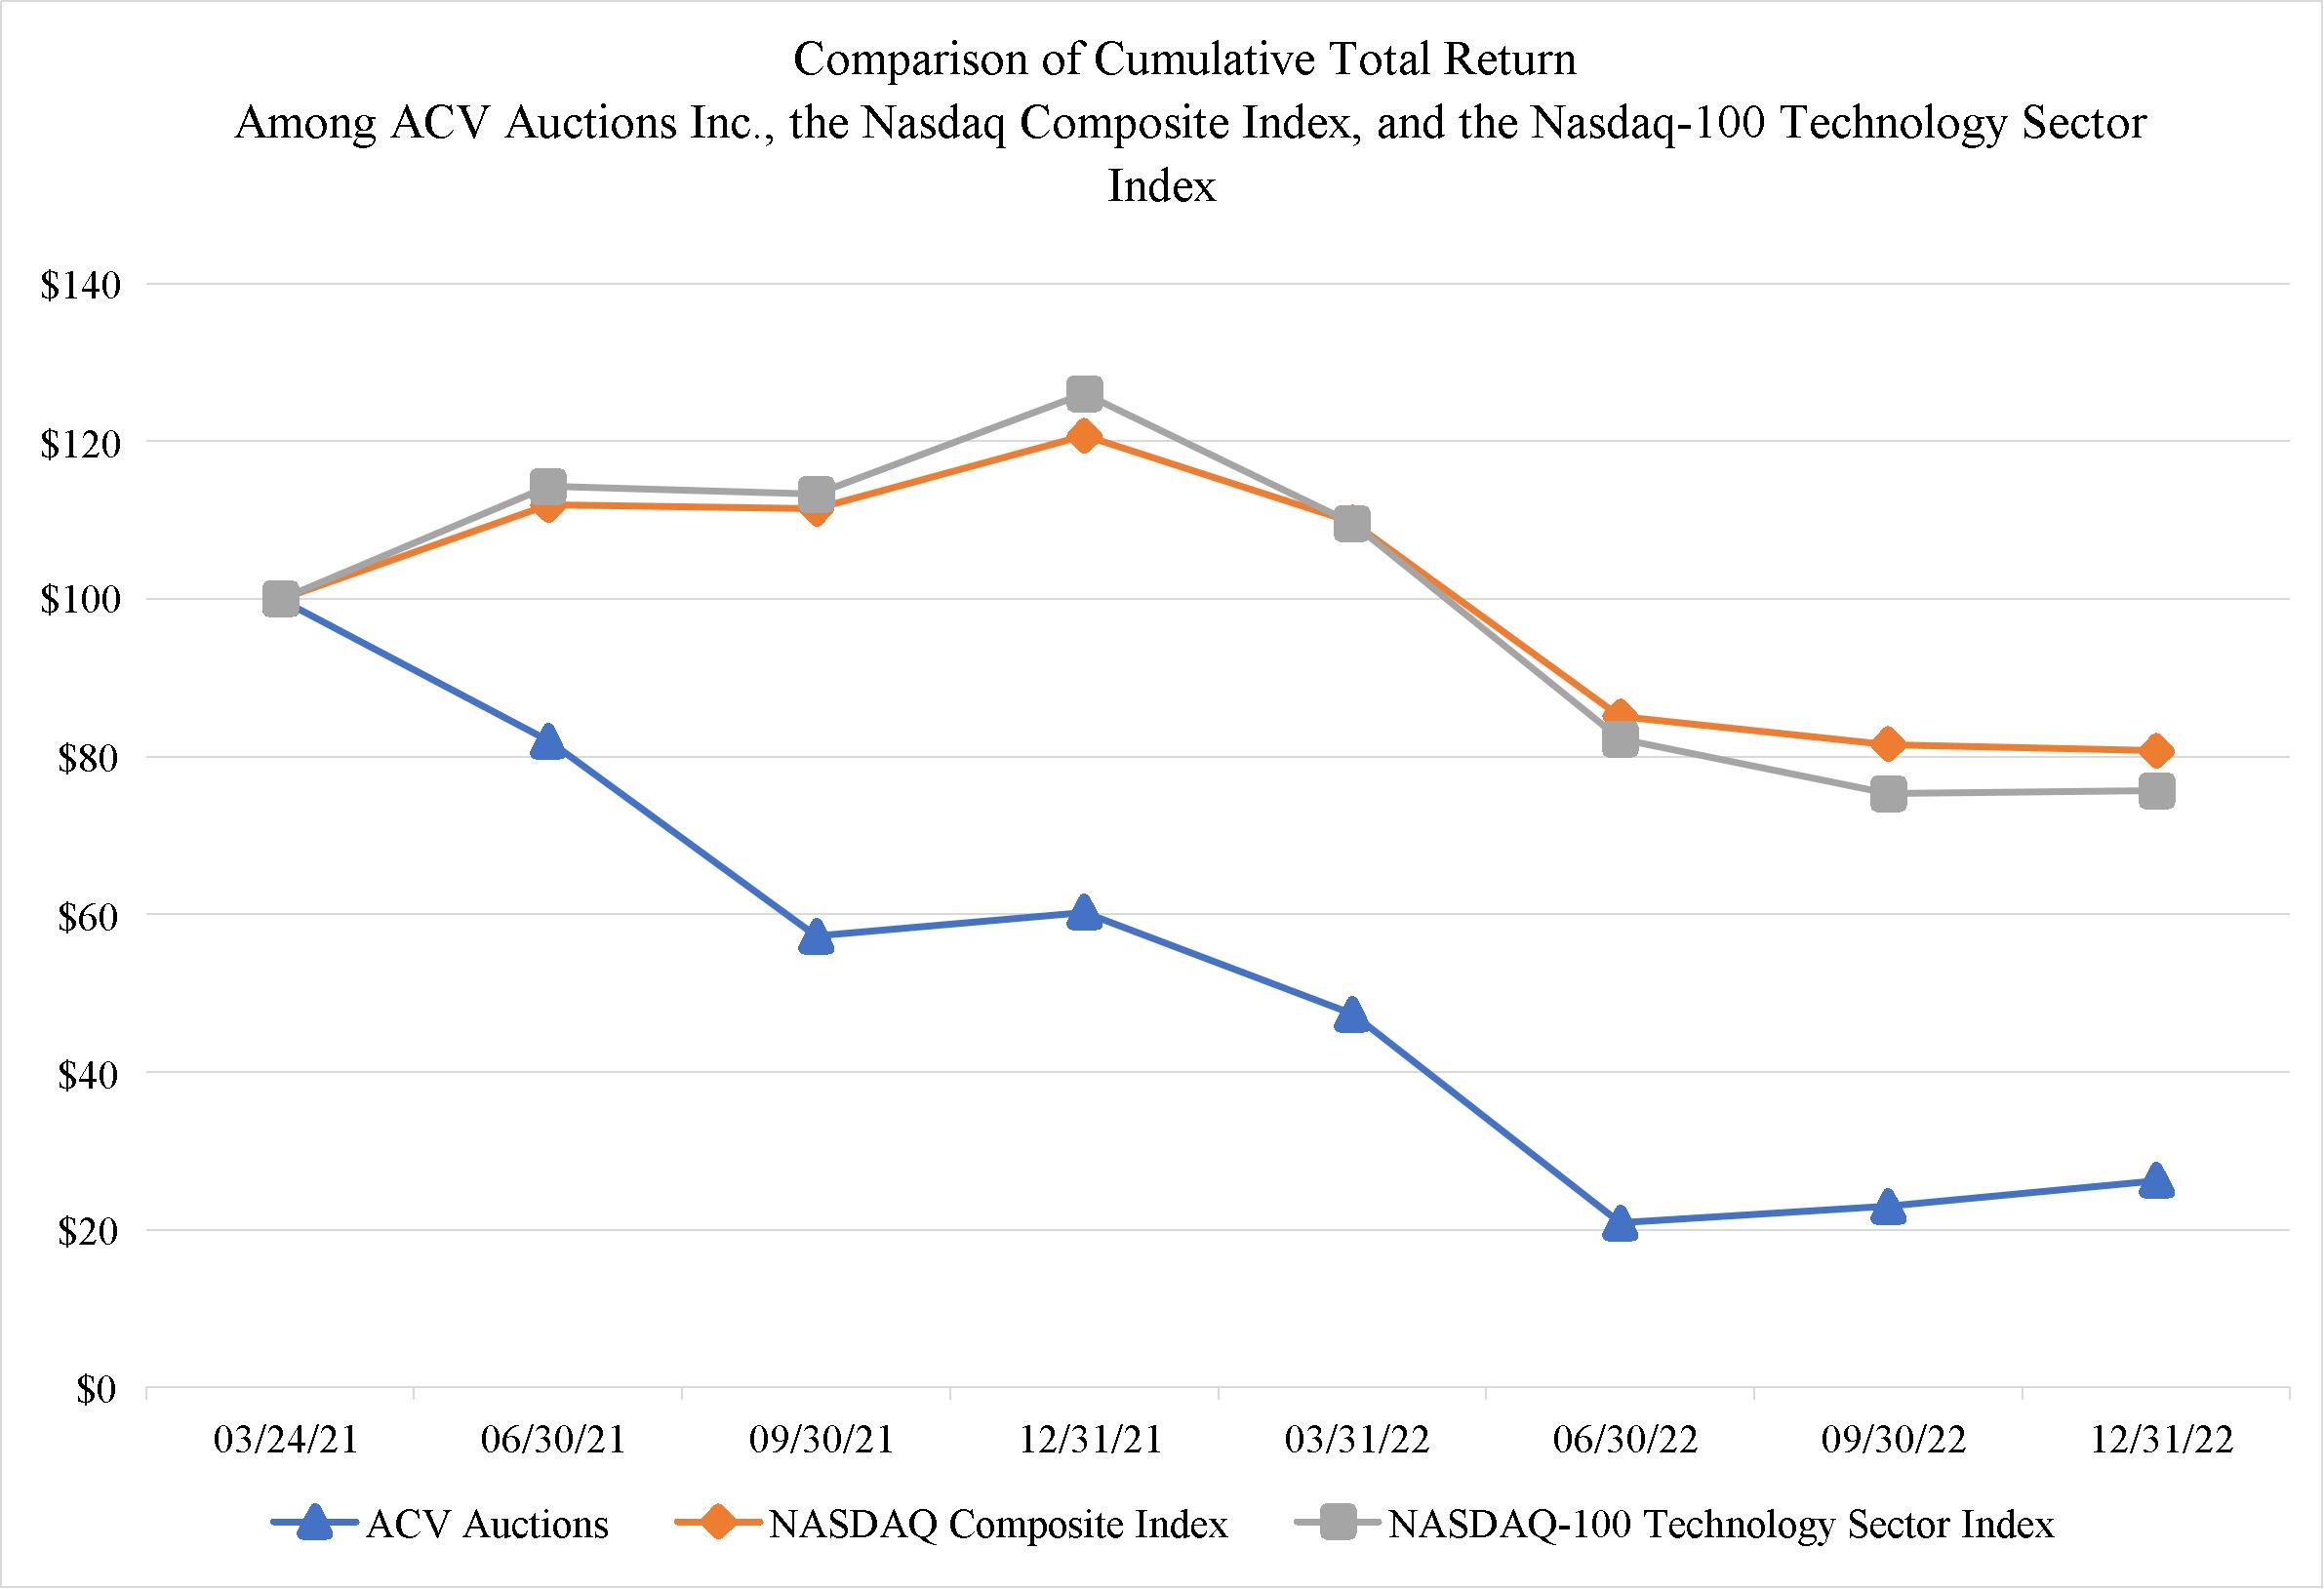
This performance graph shall not be deemed "soliciting material" or to be "filed" with the SEC for purposes of Section 18 of the Exchange Act, or otherwise subject to the liabilities under that Section, and shall not be deemed to be incorporated by reference into any filing of ACV Auctions Inc. under the Securities Act or the Exchange Act.
Item 6. [Reserved]
45
Item 7. Management’s Discussion and Analysis of Financial Condition and Results of Operations.
The following discussion and analysis of our financial condition and results of operations should be read in conjunction with our audited consolidated financial statements and related notes appearing elsewhere in this Annual Report on Form 10- K. This discussion, particularly information with respect to our financial condition or results of operations,, business strategy and plans and objectives of management for future operations, includes forward-looking statements that involve risks and uncertainties as described under the heading “Special Note Regarding Forward-Looking Statements” in this Annual Report on Form 10-K. You should review the disclosure under the heading “Item 1A. Risk Factors” in this Annual Report on Form 10-K for a discussion of important factors that could cause our actual results to differ materially from those anticipated in these forward-looking statements contained in the following discussion and analysis.
A discussion regarding our financial condition and results of operations for the year ended December 31, 2022 compared to the year ended December 31, 2021 is presented below. A discussion regarding our financial condition and results of operations for the year ended December 31, 2021 compared to the year ended December 31, 2020 can be found in “Management's Discussion and Analysis of Financial Condition and Results of Operations” in our 2021 Form 10-K filed with the SEC on February 23, 2022.
Overview
Our mission is to build and enable the most trusted and efficient digital marketplace for buying and selling used vehicles with transparency and comprehensive data that was previously unimaginable.
We provide a highly efficient and vibrant digital marketplace for wholesale vehicle transactions and data services that offer transparent and accurate vehicle information to our customers. Our platform leverages data insights and technology to power our digital marketplace and data services, enabling our dealers and commercial partners to buy, sell, and value vehicles with confidence and efficiency. We strive to solve the challenges that the used automotive industry has faced for generations and provide powerful technology-enabled capabilities to our dealers and commercial partners who fulfill a critical role in the automotive ecosystem. We help dealers source and manage inventory and accurately price their vehicles as well as process payments, transfer titles, manage arbitrations, and finance and transport vehicles. Our platform encompasses:
We have historically generated the majority of our revenue from our digital marketplace where we earn auction and ancillary fees from both buyers and sellers in each case only upon a successful auction. Buyer auction fees are variable based on the price of the vehicle, while seller auction fees include a fixed auction fee and an optional fee for the elective condition report associated with the vehicle. We also earn ancillary fees through additional value-added services to buyers and sellers in connection with the auction.
46
Our customers include participants on our marketplace and purchasers of our data services. Certain dealers and commercial partners purchase data services in connection with vehicle assessments, software subscriptions, and transactions that do not occur on our marketplace. Our dealer customers include a majority of the top 100 used vehicle dealers in the United States.
We had 546,088 and 560,959 Marketplace Units sold on our marketplace, representing a total Marketplace Gross Merchandise Value, or Marketplace GMV, of $9.0 billion and $7.9 billion, for the years ended December 31, 2022 and 2021, respectively. In the years ended December 31, 2022 and 2021, we generated revenue of $421.5 million and $358.4 million, net loss of $102.2 million and $78.2 million, and adjusted EBITDA of $(56.4) million and $(44.1) million, respectively. We continue to invest in growth to scale our company responsibly and drive towards sustained profitability. See the section titled “—Key Operating and Financial Metrics” for additional information on Marketplace Units, Marketplace GMV and Adjusted EBITDA.
Key Operating and Financial Metrics
We regularly monitor a number of operating and financial metrics in order to measure our current performance and estimate our future performance. Our business metrics may be calculated in a manner different than similar business metrics used by other companies.
|
Year ended December 31, |
|
||||||||
|
|
2022 |
|
|
2021 |
|
||||
Marketplace Units |
|
|
|
546,088 |
|
|
|
|
560,959 |
|
Marketplace GMV |
|
$ |
|
9.0 billion |
|
|
$ |
|
7.9 billion |
|
Marketplace Buyers |
|
|
|
14,453 |
|
|
|
|
14,064 |
|
Marketplace Sellers |
|
|
|
10,285 |
|
|
|
|
9,025 |
|
Adjusted EBITDA |
|
$ |
|
(56.4) million |
|
|
$ |
|
(44.1) million |
|
Marketplace Units
Marketplace Units is a key indicator of our potential for growth in Marketplace GMV and revenue. It demonstrates the overall engagement of our customers on the ACV platform, the vibrancy of our digital marketplace and our market share of wholesale transactions in the United States. We define Marketplace Units as the number of vehicles transacted on our marketplace within the applicable period. Marketplace Units transacted includes any vehicle that successfully reaches sold status, even if the auction is subsequently unwound, meaning the buyer or seller does not complete the transaction. These instances have been immaterial to date. Marketplace Units exclude vehicles that were inspected by ACV, but not sold on our digital marketplace. Since the launch of our platform, Marketplace Units have generally increased as we have expanded our territory coverage, added new Marketplace Buyers and Marketplace Sellers to our platform and increased our share of wholesale transactions from existing customers. Because we only earn auction and ancillary fees in the case of a successful auction, Marketplace Units will remain a critical driver of our revenue growth.
Marketplace GMV
Marketplace GMV is primarily driven by the volume and dollar value of Marketplace Units transacted on our digital marketplace. We believe that Marketplace GMV acts as an indicator of the success of our marketplace, signaling satisfaction of dealers and buyers on our marketplace, and the health, scale, and growth of our business. We define Marketplace GMV as the total dollar value of vehicles transacted through our digital marketplace within the applicable period, excluding any auction and ancillary fees. Because our definition of Marketplace Units does not include vehicles inspected but not sold on our digital marketplace, GMV does not represent revenue earned by us. We expect that Marketplace GMV will continue to grow as Marketplace Units grow, though at a varying rate within a given applicable period, as Marketplace GMV is also impacted by the value of each vehicle transacted. Due to the historically high values of used automobiles in the current environment, it is possible that as values normalize in the future, Marketplace GMV could decline even as Marketplace Units grow.
47
Marketplace Buyers
We define Marketplace Buyers as dealers or commercial partners with a unique customer ID that have transacted at least once in the last 12 months as a buyer on our digital marketplace. Marketplace Buyers include independent and franchise dealers buying on our marketplace.
Marketplace Sellers
We define Marketplace Sellers as dealers or commercial partners with a unique customer ID that have transacted at least once in the last 12 months as a seller on our digital marketplace. Marketplace Sellers include independent and franchise dealers selling on our marketplace, as well as commercial partners, consisting of commercial leasing companies, rental car companies, bank or other finance companies, who use our marketplace to sell their inventory.
We monitor the growth in both Marketplace Buyers and Marketplace Sellers as they each promote a more vibrant and healthy marketplace. We believe that our growth in Marketplace Sellers and Marketplace Buyers over time has been driven by the value proposition of our offerings, and our sales and marketing success, including our ability to attract new dealers and commercial partners to our digital marketplace. Based on our current position in the market, we believe that we have significant opportunity to continue to increase the number of Marketplace Buyers and Marketplace Sellers.
Adjusted EBITDA
Adjusted EBITDA is a performance measure that we use to assess our operating performance and the operating leverage in our business. We define Adjusted EBITDA as net income (loss), adjusted to exclude: depreciation and amortization, stock-based compensation expense, interest (income) expense, other (income) expense, net, provision for income taxes, and other one-time, non-recurring items, when applicable. We monitor Adjusted EBITDA as a non-GAAP financial measure to supplement the financial information we present in accordance with generally accepted accounting principles, or GAAP, to provide investors with additional information regarding our financial results. For further explanation of the uses and limitations of this measure and a reconciliation of our Adjusted EBITDA to the most directly comparable GAAP measure, net income (loss), please see “—Non-GAAP Financial Measures.”
We expect Adjusted EBITDA to fluctuate in the near term as we continue to invest in our business and improve over the long term as we achieve greater scale in our business and efficiencies in our operating expenses.
Factors Affecting Our Performance
We believe that the growth and future success of our business depend on many factors. While each of these factors presents significant opportunities for our business, they also pose important challenges that we must successfully address in order to sustain our growth, improve our results of operations, and increase profitability.
Increasing Marketplace Units
Increasing Marketplace Units is a key driver of our revenue growth. The transparency, efficiency and vibrancy of our marketplace is critical to our ability to grow our share of wholesale transactions from existing customers and attract new buyers and sellers to our digital marketplace. Failure to increase the number of Marketplace Units would adversely affect our revenue growth, operating results, and the overall health of our marketplace.
48
Grow Our Share of Wholesale Transactions from Existing Customers
Our success depends in part on our ability to grow our share of wholesale transactions from existing customers, increasing their engagement and spend on our platform. We remain in the early stages of penetrating our Marketplace Buyers and Sellers’ total number of wholesale transactions. As we continue to invest in eliminating key risks of uncertainty related to the auction process through our trusted and efficient digital marketplace, we expect that we will capture an increasing share of transactions from our existing buyers and sellers. Our ability to increase share from existing customers will depend on a number of factors, including our customers’ satisfaction with our platform, competition, pricing and overall changes in our customers’ engagement levels.
Add New Marketplace Buyers and Marketplace Sellers
We believe we have a significant opportunity to add new marketplace participants. As we expand our presence within our existing territories, we are able to drive increased liquidity and greater vehicle selection, which in turn improves our ability to attract new Marketplace Buyers and Marketplace Sellers. Additionally, we intend to add more commercial consignors to our digital marketplace and capture a greater share of vehicles in the wholesale market that are sold to dealers by commercial consignors through auctions and private sales.
Our ability to attract new Marketplace Buyers and Marketplace Sellers will depend on a number of factors including: the ability of our sales team to onboard dealers and commercial consignors onto our platform and ensure their satisfaction, the ability of our territory managers to build awareness of our brand, the ability of our vehicle condition inspectors, or VCIs, to cultivate relationships with our customers in their respective territories, and the effectiveness of our marketing efforts.
Grow Awareness for Our Offerings and Brand
Wholesale vehicle online penetration is just beginning, lagging the consumer automotive market, and we expect more dealers and commercial partners to source and manage their inventory online. As the digitization of the wholesale automotive market accelerates, we believe that our digital marketplace is well positioned to capture a disproportionate share of that growth. We plan to use targeted sales and marketing efforts to educate potential Marketplace Buyers and Marketplace Sellers as to the benefits of our offerings and drive adoption of our platform. Our ability to grow awareness of our offerings and brand depend on a number of factors, including:
Our future success is dependent on our ability to successfully grow our market presence and market and sell existing and new products to both new and existing customers.
49
Grow Value-Added and Data Services
We plan to continue to drive customer adoption of our existing value-added and data services and introduce new and complementary products. Our ability to drive higher attachment rates of existing value-added services, such as ACV Transportation and ACV Capital, will help grow our revenue. In 2019 we launched our financing arm, ACV Capital. In 2021, we added MAX Digital's flagship inventory management system to our portfolio of data services offerings. We plan to drive customer adoption of our data services such as our True360 Reports that bring transparency and offer insights into the condition and value of used vehicles as well as our inventory management system, which enables dealers to accurately price wholesale and retail inventory while maximizing profit by leveraging predictive analytics informed by machine learning. These data services enable our customers to make more informed inventory management decisions both on and off our digital marketplace. In addition, we will continue to focus on developing new products and services that enhance our platform in areas including new data-powered products. Our ability to drive customer adoption of these products and services is dependent on the pricing of our products, the offerings of our competitors and the effectiveness of our marketing efforts.
Investment in Growth
We are actively investing in our business. In order to support our future growth and expanded product offerings, we expect this investment to continue. We anticipate that our operating expenses will increase as we continue to build our sales and marketing efforts, expand our employee base and invest in our technology development. The investments we make in our platform are designed to grow our revenue opportunity and to improve our operating results in the long term, but these investments could also delay our ability to achieve profitability or reduce our profitability in the near term. Our success is dependent on making value-generative investments that support our future growth.
Used Car Demand
Our success depends in part on sufficient demand for used vehicles. Our recent growth over the last several years has coincided with a rising consumer demand for used vehicles. Since early 2020 demand for cars has outpaced supply. During this period we have seen new car supply have a significant impact on the supply of wholesale vehicles available within our marketplace. More recently, new vehicle supply has begun to increase, although still below 2019 levels. However, this increase in new vehicle supply has been coupled with an increase in interest rates which has made both new and used vehicles more expensive for retail consumers utilizing financing. Used car demand will be in part dependent on the economic health of the retail consumer and their ability to afford a vehicle purchase.
Used vehicle sales are also seasonal. Sales typically peak late in the first quarter and early in the second quarter, with the lowest relative level of industry vehicle sales occurring in the fourth quarter. Due to our growth since launch, our sales patterns to date have not been entirely reflective of the general seasonality of the used vehicle market, but we expect this to normalize as our business matures. Seasonality also impacts used vehicle pricing, with used vehicles depreciating at a faster rate in the last two quarters of each year and a slower rate in the first two quarters of each year. We may experience seasonal and other fluctuations in our quarterly results of operations, which may not fully reflect the underlying performance of our business. See the section titled “Seasonality” for additional information on the impacts of seasonality on our business.
COVID-19 and Supply Shortages
In March 2020, our business and operations began to experience the effects of the worldwide COVID-19 pandemic. Starting in May 2020, our marketplace activity rebounded strongly to reach levels higher than the months of January and February 2020 prior to the impact of COVID-19. As supply constraints began to ease and the demand and supply for used vehicles reached a better equilibrium in the fourth quarter of 2020, the growth in our transaction volume and revenue normalized. In 2021, the supply and demand in our marketplace continued to be impacted by the semiconductor supply shortage and COVID-19-related production disruptions.
50
The factors described above continue to limit the supply of new vehicles and contribute to short-term volatility in used vehicle sales, including those on our marketplace. New car supply has had a significant impact on the supply of wholesale vehicles available within our marketplace over the period. We are continuing to monitor the effects of these factors on our business and industry. In particular, the extent to which COVID-19 will continue to impact our business, and the broader implications of the pandemic on our sustained results of operations, remain uncertain. We cannot predict how the pandemic will continue to develop, whether and to what extent government regulations or other restrictions may impact our operations or those of our customers, or whether and to what extent the pandemic or the effects thereof may have longer term unanticipated impacts on our business.
Components of Results of Operations
Revenue
Marketplace and Service Revenue
We have historically generated the majority of our revenue from our digital marketplace where we earn auction and ancillary fees from both buyers and sellers, in each case only upon a successful auction. Our marketplace and service revenue consists principally of revenue earned from facilitating auctions and arranging for the transportation of vehicles purchased in such auctions.
We act as an agent when facilitating a vehicle auction through the marketplace. Auction and related fees charged to the buyer and seller are reported as revenue on a net basis, excluding the price of the auctioned vehicle in the transaction.
We act as a principal when arranging for the transportation of vehicles purchased on the marketplace and leverage our network of third-party transportation carriers to secure the arrangement. Transportation fees charged to the buyer are reported on a gross basis.
We also generate data services revenue through our True360 reports and MAX Digital inventory management software subscriptions and offer short-term inventory financing to eligible customers purchasing vehicles through the marketplace.
Customer Assurance Revenue
We also generate revenue by providing our Go Green assurance to sellers on the condition of certain vehicles sold on the marketplace, which is considered a guarantee under GAAP. This assurance option is only available for sellers who have enrolled in the service on qualifying vehicles for which we have prepared the vehicle condition report. Customer assurance revenue also includes revenue from other price guarantee products offered to sellers. Customer assurance revenue is measured based upon the fair value of the Go Green assurance that we provide. We expect the fair value per vehicle assured to decrease over time as we continue to improve the quality of our inspection product, which in turn reduces the costs of satisfying such assurance.
Operating Expenses
Marketplace and Service Cost of Revenue
Marketplace and service cost of revenue consists of third-party transportation carrier costs, titles shipping costs, customer support, website hosting costs, inspection costs related to data services and various other costs. These costs include salaries, benefits, bonuses and related stock-based compensation expenses, which we refer to as personnel expenses. We expect our marketplace and service cost of revenue to continue to increase in absolute dollars as we continue to scale our business and introduce new product and service offerings.
Customer Assurance Cost of Revenue
Customer assurance cost of revenue consists of the costs related to satisfying claims against the vehicle condition guarantees, and other price guarantees. We expect that our customer assurance cost of revenue will increase in absolute dollars as our business grows, particularly as we provide guarantees on an increasing number of vehicles.
51
Operations and Technology
Operations and technology expense consists of costs for wholesale auction inspections, personnel costs related to payments and titles processing, transportation processing, product and engineering and other general operations and technology expenses. These costs include personnel-related expenses and other allocated facility and office costs. We expect that our operations and technology expense will increase in absolute dollars as our business grows, particularly as we incur additional costs related to continued investments in our marketplace, transportation capabilities and other technologies.
Selling, General and Administrative
Selling, general and administrative expense consists of costs resulting from sales, accounting, finance, legal, marketing, human resources, executive, and other administrative activities. These costs include personnel-related expenses, legal and other professional services expenses and other allocated facility and office costs. Also included in selling, general and administrative expense is advertising and marketing costs to promote our services. We expect that our selling, general and administrative expense will increase in absolute dollars as our business grows. However, we expect that our selling, general and administrative expense will decrease as a percentage of our revenue as our revenue grows over the longer term.
Depreciation and Amortization
Depreciation and amortization expense consists of depreciation of fixed assets, and amortization of acquired intangible assets and internal-use software.
Other Income (Expense)
Other income (expense) consists primarily of interest income earned on our marketable securities and cash and cash equivalents. Other income (expense) also includes interest expense on our borrowings.
Provision for Income Taxes
Provision for income taxes consists of U.S. federal, state and foreign income taxes.
52
Results of Operations
The following table sets forth our Consolidated Statements of Operations data expressed as a percentage of total revenue for the periods presented:
|
|
Year ended December 31, |
|
|||||||||||||
|
|
2022 |
|
|
2021 |
|
||||||||||
|
|
Amount |
|
|
% of |
|
|
Amount |
|
|
% of |
|
||||
|
|
(in thousands) |
|
|||||||||||||
Revenue: |
|
|
|
|
|
|
|
|
|
|
|
|
||||
Marketplace and service revenue |
|
$ |
361,585 |
|
|
|
86 |
% |
|
$ |
308,350 |
|
|
|
86 |
% |
Customer assurance revenue |
|
|
59,944 |
|
|
|
14 |
% |
|
|
50,085 |
|
|
|
14 |
% |
Total revenue |
|
|
421,529 |
|
|
|
100 |
% |
|
|
358,435 |
|
|
|
100 |
% |
Operating expenses: |
|
|
|
|
|
|
|
|
|
|
|
|
||||
Marketplace and service cost of revenue |
|
|
183,968 |
|
|
|
44 |
% |
|
|
159,405 |
|
|
|
44 |
% |
Customer assurance cost of revenue |
|
|
52,685 |
|
|
|
12 |
% |
|
|
45,348 |
|
|
|
13 |
% |
Operations and technology (1)(5) |
|
|
136,522 |
|
|
|
32 |
% |
|
|
101,056 |
|
|
|
28 |
% |
Selling, general, and administrative (1) (3)(5) |
|
|
143,636 |
|
|
|
34 |
% |
|
|
121,167 |
|
|
|
34 |
% |
Depreciation and amortization (2)(4) |
|
|
10,926 |
|
|
|
3 |
% |
|
|
8,264 |
|
|
|
2 |
% |
Total operating expenses |
|
|
527,737 |
|
|
|
|
|
|
435,240 |
|
|
|
|
||
Income (loss) from operations |
|
|
(106,208 |
) |
|
|
|
|
|
(76,805 |
) |
|
|
|
||
Other income (expense): |
|
|
|
|
|
|
|
|
|
|
|
|
||||
Interest income |
|
|
5,082 |
|
|
|
|
|
|
129 |
|
|
|
|
||
Interest expense |
|
|
(979 |
) |
|
|
|
|
|
(782 |
) |
|
|
|
||
Total other income (expense) |
|
|
4,103 |
|
|
|
|
|
|
(653 |
) |
|
|
|
||
Income (loss) before income taxes |
|
|
(102,105 |
) |
|
|
|
|
|
(77,458 |
) |
|
|
|
||
Provision for income taxes |
|
|
87 |
|
|
|
|
|
|
724 |
|
|
|
|
||
Net income (loss) |
|
$ |
(102,192 |
) |
|
|
|
|
$ |
(78,182 |
) |
|
|
|
||
53
(1) Includes stock-based compensation expense as follows: |
|
Year ended December 31, |
|
||||||
|
|
2022 |
|
|
2021 |
|
|||
|
|
(in thousands) |
|
||||||
Marketplace and service cost of revenue (excluding |
|
$ |
673 |
|
|
$ |
329 |
|
|
Operations and technology |
|
|
9,342 |
|
|
|
3,486 |
|
|
Selling, general, and administrative |
|
|
29,309 |
|
|
|
19,405 |
|
|
Stock-Based Compensation Expense |
|
$ |
39,324 |
|
|
$ |
23,220 |
|
|
|
|
|
|
|
|
|
|||
(2) Includes intangible asset amortization as follows: |
|
Year ended December 31, |
|
||||||
|
0 |
|
2022 |
|
|
2021 |
|
||
|
|
(in thousands) |
|
||||||
Depreciation and amortization |
|
$ |
4,869 |
|
|
$ |
4,012 |
|
|
Intangible Asset Amortization |
|
$ |
4,869 |
|
|
$ |
4,012 |
|
|
|
|
|
|
|
|
|
|||
(3) Includes contingent losses (gains) as follows: |
|
Year ended December 31, |
|
||||||
|
0 |
|
2022 |
|
|
2021 |
|
||
|
|
(in thousands) |
|
||||||
Selling, general, and administrative |
|
$ |
(1,550 |
) |
|
$ |
— |
|
|
Contingent losses (gains) |
|
$ |
(1,550 |
) |
|
$ |
— |
|
|
|
|
|
|
|
|
|
|||
(4) Includes amortization of capitalized stock based compensation as follows: |
|
Year ended December 31, |
|
||||||
|
0 |
|
2022 |
|
|
2021 |
|
||
|
|
(in thousands) |
|
||||||
Depreciation and amortization |
|
$ |
555 |
|
|
$ |
— |
|
|
Amortization of capitalized stock based compensation |
|
$ |
555 |
|
|
$ |
— |
|
|
|
|
|
|
|
|
|
|||
(5) Includes other adjustments as follows: |
|
Year ended December 31, |
|
||||||
|
0 |
|
2022 |
|
|
2021 |
|
||
|
|
(in thousands) |
|
||||||
Operations and technology |
|
$ |
220 |
|
|
$ |
— |
|
|
Selling, general, and administrative |
|
|
241 |
|
|
|
— |
|
|
Other adjustments |
|
$ |
461 |
|
|
$ |
— |
|
|
Comparison of the Years Ended December 31, 2022 and December 31, 2021
Revenue
Marketplace and Service Revenue
|
|
Year ended December 31, |
|
|
$ Change |
|
|
% Change |
|
|||||||
|
|
2022 |
|
|
2021 |
|
|
|
|
|
|
|
||||
|
|
(in thousands) |
|
|
|
|
|
|
|
|||||||
Marketplace and service revenue |
|
$ |
361,585 |
|
|
$ |
308,350 |
|
|
$ |
53,235 |
|
|
|
17 |
% |
The increase was primarily driven by an increase in revenue earned from arranging for the transportation of vehicles to buyers, revenue earned from auction sales, and data services revenue. Auction revenue increases in the current year were primarily driven by GMV, which rose due to the increase in demand for used vehicles on a national level, leading to higher buyer revenue per unit. Additionally, we raised the buyer fees charged on our marketplace effective in October 2022 that further contributed to the increase in revenue year-over-year, and specifically within the fourth quarter. For the year ended December 31, 2022 compared to the year ended December 31, 2021 auction marketplace revenue increased to $175.7 million from $164.3 million, other marketplace revenue increased to $153.0 million from $121.0 million, and data services revenue increased to $32.9 million from $23.1 million.
54
Customer Assurance Revenue
|
|
Year ended December 31, |
|
|
$ Change |
|
|
% Change |
|
|||||||
|
|
2022 |
|
|
2021 |
|
|
|
|
|
|
|
||||
|
|
(in thousands) |
|
|
|
|
|
|
|
|||||||
Customer assurance revenue |
|
$ |
59,944 |
|
|
$ |
50,085 |
|
|
$ |
9,859 |
|
|
|
20 |
% |
The increase primarily consisted of an increase in revenue generated from our Go Green assurance offerings sold to sellers in marketplace transactions. For the year ended December 31, 2022, Go Green assurance revenue increased to $53.8 million from $45.4 million in the year ended December 31, 2021. Revenue increases were primarily a result of an increase in the estimated fair value per unit.
Operating Expenses
Marketplace and Service Cost of Revenue
|
|
Year ended December 31, |
|
|
$ Change |
|
|
% Change |
|
|||||||
|
|
2022 |
|
|
2021 |
|
|
|
|
|
|
|
||||
|
|
(in thousands) |
|
|
|
|
|
|
|
|||||||
Marketplace and service cost of revenue (excluding |
|
$ |
183,968 |
|
|
$ |
159,405 |
|
|
$ |
24,563 |
|
|
|
15 |
% |
Percentage of revenue |
|
|
44 |
% |
|
|
44 |
% |
|
|
|
|
|
|
||
The increase primarily consisted of an increase in the cost of generating other marketplace revenue, an increase attributed to the cost of generating auction marketplace revenue and data services revenue. For the year ended December 31, 2022 compared to the year ended December 31, 2021, total cost attributed to generating auction marketplace revenue increased to $29.1 million from $21.0 million, the total cost of generating other marketplace revenue increased to $132.8 million from $121.3 million, and the total cost of generating data services revenue increased to $22.1 million from $17.1 million. For the year ended December 31, 2022 compared to year ended December 31, 2021, direct and allocated personnel and related costs included in auction marketplace increased to $11.8 million from $8.5 million, non-personnel related costs included in auction marketplace increased to $17.3 million from $12.5 million, and non-personnel related costs included in transportation and other services increased to $132.3 million from $121.1 million. The 15% increase in Marketplace and service cost of revenue was primarily driven by the 17% increase in Marketplace and service revenue which correlates to an increase in operating expenses to support those revenues. Marketplace and service cost of revenue as a percentage of revenue remained consistent during the years ended December 31, 2022 and December 31, 2021.
55
Customer Assurance Cost of Revenue
|
|
Year ended December 31, |
|
|
$ Change |
|
|
% Change |
|
|||||||
|
|
2022 |
|
|
2021 |
|
|
|
|
|
|
|
||||
|
|
(in thousands) |
|
|
|
|
|
|
|
|||||||
Customer assurance cost of revenue (excluding |
|
$ |
52,685 |
|
|
$ |
45,348 |
|
|
$ |
7,337 |
|
|
|
16 |
% |
Percentage of revenue |
|
|
12 |
% |
|
|
13 |
% |
|
|
|
|
|
|
||
The increase primarily consisted of costs attributable to our Go Green and other assurance offerings and was primarily driven by increased Go Green unit volume as compared to prior year, as well as increases in Go Green assurance costs which vary based upon average vehicle value and claim activity. For the year ended December 31, 2022, Go Green assurance cost of revenue increased to $47.0 million from $40.4 million in the year ended December 31, 2021, and other assurance cost of revenue increased to $5.7 million from $4.9 million. Customer assurance cost of revenue as a percentage of revenue remained consistent during the years ended December 31, 2022 and December 31, 2021.
Operations and Technology Expenses
|
|
Year ended December 31, |
|
|
$ Change |
|
|
% Change |
|
|||||||
|
|
2022 |
|
|
2021 |
|
|
|
|
|
|
|
||||
|
|
(in thousands) |
|
|
|
|
|
|
|
|||||||
Operations and technology |
|
$ |
136,522 |
|
|
$ |
101,056 |
|
|
$ |
35,466 |
|
|
|
35 |
% |
Percentage of revenue |
|
|
32 |
% |
|
|
28 |
% |
|
|
|
|
|
|
||
The increase primarily consisted of an increase in personnel and related costs and software and technology expenses. For the year ended December 31, 2022, personnel and related costs increased to $117.7 million from $85.4 million in the year ended December 31, 2021 as a result of increased headcount, and software and technology expenses increased to $13.9 million from $11.1 million in the year ended December 31, 2021 as a result of continued investment in our technology and infrastructure. Operations and technology expense as a percentage of revenue increased 4% due to the increased investments in workforce expansion which will support future growth.
Selling, General, and Administrative Expenses
|
|
Year ended December 31, |
|
|
$ Change |
|
|
% Change |
|
|||||||
|
|
2022 |
|
|
2021 |
|
|
|
|
|
|
|
||||
|
|
(in thousands) |
|
|
|
|
|
|
|
|||||||
Selling, general, and administrative |
|
$ |
143,636 |
|
|
$ |
121,167 |
|
|
$ |
22,469 |
|
|
|
19 |
% |
Percentage of revenue |
|
|
34 |
% |
|
|
34 |
% |
|
|
|
|
|
|
||
The increase primarily consisted of increases in personnel and related costs. For the year ended December 31, 2022, personnel related costs increased to $117.7 million from $102.7 million in the year ended December 31, 2021 as a result of increased headcount. For the year ended December 31, 2022, other expenses increased to $21.7 million from $13.7 million in the year ended December 31, 2021 from increased litigation accruals and bad debt expense. Bad debt expense increase was the result of more challenging macroeconomic conditions in 2022 which impacted our customers. Selling, general, and administrative expense as a percentage of revenue remained consistent during the years ended December 31, 2022 and December 31, 2021.
Depreciation and Amortization
|
|
Year ended December 31, |
|
|
$ Change |
|
|
% Change |
|
|||||||
|
|
2022 |
|
|
2021 |
|
|
|
|
|
|
|
||||
|
|
(in thousands) |
|
|
|
|
|
|
|
|||||||
Depreciation and amortization |
|
$ |
10,926 |
|
|
$ |
8,264 |
|
|
$ |
2,662 |
|
|
|
32 |
% |
Percentage of revenue |
|
|
3 |
% |
|
|
2 |
% |
|
|
|
|
|
|
||
56
The increase was primarily due to an increase of $1.6 million in amortization of internal-use software costs. The remaining year-over-year increase of $0.9 million was attributable to amortization of acquired intangible assets. The increase in depreciation and amortization as a percentage of revenue is due to the increased amortization of internal-use software.
Interest Income
|
|
Year ended December 31, |
|
|
$ Change |
|
|
% Change |
|
|||||||
|
|
2022 |
|
|
2021 |
|
|
|
|
|
|
|
||||
|
|
(in thousands) |
|
|
|
|
|
|
|
|||||||
Interest income |
|
$ |
5,082 |
|
|
$ |
129 |
|
|
$ |
4,953 |
|
|
|
3840 |
% |
The increase is due to marketable securities increasing to $215.9 million as of December 31, 2022 from $13.8 million as of December 31, 2021 as well as rising market interest rates.
Interest Expense
|
|
Year ended December 31, |
|
|
$ Change |
|
|
% Change |
|
|||||||
|
|
2022 |
|
|
2021 |
|
|
|
|
|
|
|
||||
|
|
(in thousands) |
|
|
|
|
|
|
|
|||||||
Interest expense |
|
$ |
(979 |
) |
|
$ |
(782 |
) |
|
$ |
(197 |
) |
|
|
25 |
% |
Interest expense on the revolving lines of credit was $1.0 million for the year ended December 31, 2022, compared to $0.8 million for the year ended December 31, 2021.
Provision for Income Taxes
|
|
Year ended December 31, |
|
|
$ Change |
|
|
% Change |
|
|||||||
|
|
2022 |
|
|
2021 |
|
|
|
|
|
|
|
||||
|
|
(in thousands) |
|
|
|
|
|
|
|
|||||||
Provision for income taxes |
|
$ |
87 |
|
|
$ |
724 |
|
|
$ |
(637 |
) |
|
|
(88 |
)% |
The provision for income taxes was $0.1 million for the year ended December 31, 2022 and $0.7 million for year ended December 31, 2021.
Non-GAAP Financial Measures
Adjusted EBITDA
We report our financial results in accordance with GAAP. However, management believes that Adjusted EBITDA, a non-GAAP financial measure, provides investors with additional useful information in evaluating our performance.
Adjusted EBITDA is a financial measure that is not presented in accordance with GAAP. We believe that Adjusted EBITDA, when taken together with our financial results presented in accordance with GAAP, provides meaningful supplemental information regarding our operating performance and facilitates internal comparisons of our historical operating performance on a more consistent basis by excluding certain items that may not be indicative of our business, results of operations or outlook. In particular, we believe that the use of Adjusted EBITDA is helpful to our investors as it is a measure used by management in assessing the health of our business and evaluating our operating performance, as well as for internal planning and forecasting purposes.
57
Adjusted EBITDA is presented for supplemental informational purposes only, has limitations as an analytical tool and should not be considered in isolation or as a substitute for financial information presented in accordance with GAAP. Some of these limitations include that: (i) it does not properly reflect capital commitments to be paid in the future; (ii) although depreciation and amortization are non-cash charges, the underlying assets may need to be replaced and Adjusted EBITDA does not reflect these capital expenditures; (iii) it does not consider the impact of stock-based compensation expense; (iv) it does not reflect other non-operating expenses, including interest expense; (v) it does not consider the impact of any contingent consideration liability valuation adjustments; and (vi) it does not reflect tax payments that may represent a reduction in cash available to us. In addition, our use of Adjusted EBITDA may not be comparable to similarly titled measures of other companies because they may not calculate Adjusted EBITDA in the same manner, limiting its usefulness as a comparative measure. Because of these limitations, when evaluating our performance, you should consider Adjusted EBITDA alongside other financial measures, including our net income (loss) and other results stated in accordance with GAAP.
The following table presents a reconciliation of Adjusted EBITDA to net income (loss), the most directly comparable financial measure stated in accordance with GAAP, for the periods presented:
|
Year ended December 31, |
|
|||||
|
2022 |
|
|
2021 |
|
||
Adjusted EBITDA Reconciliation |
|
|
|
|
|
||
Net income (loss) |
$ |
(102,193 |
) |
|
$ |
(78,182 |
) |
Depreciation and amortization |
|
11,378 |
|
|
|
8,753 |
|
Stock-based compensation |
|
39,324 |
|
|
|
23,692 |
|
Interest (income) expense |
|
(4,103 |
) |
|
|
653 |
|
Provision for income taxes |
|
87 |
|
|
|
724 |
|
Other (income) expense, net |
|
(925 |
) |
|
|
223 |
|
Adjusted EBITDA |
$ |
(56,432 |
) |
|
$ |
(44,137 |
) |
Non-GAAP Net income (loss)
We report our financial results in accordance with GAAP. However, management believes that Non-GAAP Net loss, a financial measure that is not presented in accordance with GAAP, provides investors with additional useful information to measure operating performance and current and future liquidity when taken together with our financial results presented in accordance with GAAP. By providing this information, we believe management and the users of the financial statements are better able to understand the financial results of what we consider to be our organic, continuing operations.
In the calculation of Non-GAAP Net loss, we exclude stock-based compensation expense because of varying available valuation methodologies, subjective assumptions and the variety of equity instruments that can impact our non-cash expense. We believe that providing non-GAAP financial measures that exclude stock-based compensation expense allows for more meaningful comparisons between our operating results from period to period.
We exclude amortization of acquired intangible assets from the calculation of Non-GAAP Net loss. We believe that excluding the impact of amortization of acquired intangible assets allows for more meaningful comparisons between operating results from period to period as the underlying intangible assets are valued at the time of acquisition and are amortized over several years after the acquisition.
We exclude contingent consideration liability valuation adjustments associated with the purchase consideration of transactions accounted for as business combinations. We also exclude certain other one-time, non-recurring items of a material nature, when applicable, such as acquisition-related and restructuring expenses, because we do not consider such amounts to be part of our ongoing operations nor are they comparable to prior periods nor predictive of future results.
58
Non-GAAP net loss is presented for supplemental informational purposes only, has limitations as an analytical tool and should not be considered in isolation or as a substitute for financial information presented in accordance with GAAP. Some of these limitations include that: (i) it does not consider the impact of stock-based compensation expense; (ii) although amortization is a non-cash charge, the underlying assets may need to be replaced and Non-GAAP Net loss does not reflect these capital expenditures; (iii) it does not consider the impact of any contingent consideration liability valuation adjustments; and (iv) it does not consider the impact of other one-time charges, such as acquisition-related and restructuring expenses, which could be material to the results of our operations. In addition, our use of Non-GAAP Net loss may not be comparable to similarly titled measures of other companies because they may not calculate Non-GAAP Net loss in the same manner, limiting its usefulness as a comparative measure. Because of these limitations, when evaluating our performance, you should consider Non-GAAP Net loss alongside other financial measures, including our net loss and other results stated in accordance with GAAP.
The following table presents a reconciliation of Non-GAAP Net loss to net loss, the most directly comparable financial measure stated in accordance with GAAP, for the periods presented:
|
Year ended December 31, |
|
|||||
|
2022 |
|
|
2021 |
|
||
Non-GAAP Net loss Reconciliation |
|
|
|
|
|
||
Net loss |
$ |
(102,193 |
) |
|
$ |
(78,182 |
) |
Stock-based compensation |
|
39,324 |
|
|
|
23,692 |
|
Amortization of acquired intangible |
|
4,869 |
|
|
|
4,012 |
|
Amortization of capitalized stock |
|
555 |
|
|
|
- |
|
Contingent losses (gains) |
|
(1,550 |
) |
|
|
- |
|
Other |
|
461 |
|
|
|
- |
|
Non-GAAP Net loss |
$ |
(58,534 |
) |
|
$ |
(50,478 |
) |
Liquidity and Capital Resources
We have financed operations since our inception primarily through our marketplace revenue, borrowings under our debt facilities and the net proceeds we have received from sales of equity securities as further detailed below. In March 2021, we completed our IPO which resulted in aggregate net proceeds of $388.9 million, after deducting underwriting discounts and commissions.
As of December 31, 2022, our principal sources of liquidity were cash and cash equivalents totaling $280.8 million, and investments in marketable securities totaling $215.9 million. We believe that our existing cash and cash equivalents and cash flow from operations will be sufficient to support working capital and capital expenditure requirements for at least the next 12 months and for the long-term. Our future capital requirements over the long-term will depend on many factors, including volume of sales with existing customers, expansion of sales and marketing activities to acquire new customers, timing and extent of spending to support development efforts and introduction of new and enhanced services. We may, in the future, enter into arrangements to acquire or invest in complementary businesses, products, and technologies. We may be required to seek additional equity or debt financing. In the event that we require additional financing, we may not be able to raise such financing on terms acceptable to us or at all. If we are unable to raise additional capital or generate cash flows necessary to expand our operations and invest in continued innovation, we may not be able to compete successfully, which would harm our business, results of operations and financial condition.
As of December 31, 2022, our principal commitments primarily consist of long-term debt and leases for office space. We have $1.4 million of lease obligations due within a year, and an additional $4.0 million of lease obligations due at various dates through 2032. Refer to Note 10 Leases, of our consolidated financial statements for more information.
59
In order to compete successfully and sustain operations at current levels over the next 12 months, we will be required to devote a significant amount of operating cash flow to our human capital in the form of salaries and wages. Additionally, we enter into purchase commitments for goods and services made in the ordinary course of business. These purchase commitments include goods and services received and recorded as liabilities as of December 31, 2022 as well goods and services which have not yet been delivered or performed and have, therefore, not been reflected in our Consolidated Balance Sheets and Consolidated Statements of Operations. These commitments typically become due after the delivery and completion of such goods or services.
A substantial amount of our working capital is generated from the payments received for services which we provide. We settle transactions among buyers and sellers using the marketplace, and as a result the value of the vehicles passes through our balance sheet. Because our receivables typically have been, on average, settled faster than our payables, our cash position at each balance sheet date has been bolstered by marketplace float. Changes in working capital vary from quarter-to-quarter as a result of GMV and the timing of collections and disbursements of funds related to auctions held near period end.
Our Debt Arrangements
We currently have a revolving credit facility with Credit Suisse AG, New York Branch, or the 2019 Revolver, which we entered into in December 2019. We entered into an amendment to the 2019 Revolver on June 25, 2021. We also entered into a revolving credit facility with JP Morgan Chase Bank, N.A., or the 2021 Revolver, on August 24, 2021.
One of our wholly-owned indirect subsidiaries, ACV Capital Funding LLC, is the borrower under the 2019 Revolver, which provides for a revolving line of credit in the aggregate amount of up to $50.0 million, with borrowing availability subject to a borrowing base calculated as a percentage of ACV Capital Funding LLC’s eligible receivables. The 2019 Revolver is secured by the borrowing base of eligible receivables. In addition, we entered into a separate indemnity agreement in connection with the 2019 Revolver under which we provided an unsecured guaranty of (a) 10% of the outstanding loans under the 2019 Revolver at the time of any event of default and (b) any losses, damages or other expenses incurred by the lenders under the 2019 Revolver, payable in the event of certain specified acts by ACV Capital Funding LLC. The interest rate on any outstanding borrowings is at LIBOR plus 3.75%, subject to a LIBOR floor of 1.00%, and interest payments are payable monthly. The 2019 Revolver has a maturity date of June 25, 2024. The 2019 Revolver also contains customary covenants that limit ACV Capital Funding LLC’s ability to enter into indebtedness, make distributions and make investments, among other restrictions. The 2019 Revolver contains a liquidity covenant based on cash on hand, a tangible net worth covenant based on ACV Capital’s consolidated net worth, a tangible net worth covenant based on our consolidated net worth, a leverage covenant based on our consolidated leverage and certain other financial covenants tied to ACV Capital’s eligible receivables.
We are the borrower under the 2021 Revolver, which provides for a revolving line of credit in the aggregate principal amount of up to $160.0 million. The 2021 Revolver also includes a sub facility that provides for the issuance of letters of credit up to $20.0 million outstanding at any time. The 2021 Revolver is guaranteed by substantially all of our material domestic subsidiaries and is secured by substantially all of our and such subsidiaries’ assets. The interest rate applicable to the 2021 Revolver is, at our option, either (a) LIBOR (or a replacement rate established in accordance with the terms of the credit agreement for the 2021 Revolver) (subject to a 0.00% LIBOR floor), plus a margin of 2.75% per annum or (b) the Alternate Base Rate plus a margin of 1.75% per annum. The Alternate Base Rate is the highest of (a) the Wall Street Journal prime rate, (b) the NYFRB rate plus 0.5% and (c)(i) 1.00% plus (ii) the adjusted LIBOR rate for a one-month interest period. The 2021 Revolver has a maturity date of August 24, 2026. The 2021 Revolver contains customary covenants that limit our ability to enter into indebtedness, make distributions and make investments, among other restrictions. The 2021 Revolver also contains financial covenants that require us to maintain a minimum liquidity level and achieve specified trailing four quarter revenue targets.
We were in compliance with all such applicable covenants as of December 31, 2022, and believe we are in compliance as of the date of this Annual Report on Form 10-K. As of December 31, 2022, we had $0.5 million drawn under the 2019 Revolver, $75.0 million drawn under the 2021 Revolver, and there was an outstanding letter of credit issued under the 2021 Revolver in the amount of $1.6 million.
60
Cash Flows from Operating, Investing, and Financing Activities
The following table shows a summary of our cash flows for the periods presented:
|
|
Year ended December 31, |
|
|||||
|
|
2022 |
|
|
2021 |
|
||
|
|
(in thousands) |
|
|||||
Net cash provided by (used in) operating activities |
|
$ |
(75,175 |
) |
|
$ |
85,290 |
|
Net cash provided by (used in) investing activities |
|
|
(282,979 |
) |
|
|
(129,266 |
) |
Net cash provided by (used in) financing activities |
|
|
72,933 |
|
|
|
376,245 |
|
Effect of exchange rate changes on cash, cash equivalents, and restricted cash |
|
|
(21 |
) |
|
|
— |
|
Net (decrease) increase in cash and equivalents |
|
$ |
(285,242 |
) |
|
$ |
332,269 |
|
Operating Activities
Our largest source of operating cash is cash collection from fees earned on our marketplace services. Our primary uses of cash from operating activities are for personnel expenses, marketing expenses and overhead expenses.
In the year ended December 31, 2022, net cash used in operating activities of $75.2 million was primarily related to our net loss of $102.2 million and cash outflows of $34.7 million due to changes in our operating assets and liabilities, adjusted for non-cash charges of $61.7 million. Non-cash charges primarily consisted of stock-based compensation, depreciation and amortization of property and equipment, and provision for bad debt. The change in operating assets and liabilities were the result of a $47.2 million decrease in accounts receivable which were offset by a $73.1 million decrease in accounts payable and a $7.4 million decrease in other current and non-current liabilities.
In the year ended December 31, 2021, net cash provided by operating activities of $85.3 million was primarily related to our net loss of $78.2 million, adjusted for net cash inflows $125.9 million due to changes in our operating assets and liabilities, and for non-cash charges of $37.6 million. Non-cash charges primarily consisted of stock-based compensation, depreciation and amortization of property and equipment, and provision for bad debt. The change in operating assets and liabilities were the result of a $120.2 million increase in accounts receivable and $2.7 million increase in other operating assets, which were offset by a $242.9 million increase in accounts payable and a $5.8 million increase in other current and non-current liabilities.
The increase in net cash used in operating activities during the year ended December 31, 2022 relative to the year ended December 31, 2021 was primarily driven by changes in Accounts Receivable and Accounts Payable related to marketplace transactions.
Investing Activities
In the years ended December 31, 2022 and 2021, net cash used in investing activities was $283.0 million and $129.3 million, respectively, primarily related to purchasing marketable securities, capital expenditures to purchase property and equipment to support field and site operations, along with capitalized software development costs to support continued technology innovation, increases in finance receivables, and the use of cash for the acquisition of businesses.
The increase in net cash used in investing activities during the year ended December 31, 2022 relative to the year ended December 31, 2021 was primarily driven by an additional $188.9 million of net investments made in marketable securities offset by a decrease in business acquisitions of $45.6 million.
61
Financing Activities
In the years ended December 31, 2022, and 2021, net cash provided by financing activities was $72.9 million and $376.2 million, respectively. The decrease was primarily the result of proceeds from issuance of common stock pursuant to the IPO in 2021, which were offset by proceeds from long term debt, net repayments of long term debt during the period, payments for debt issuance and other financing costs, and the payment of RSU tax withholdings in exchange for shares of common stock surrendered by RSU holders.
Acquisitions
In the second quarter of 2020, we acquired certain assets from ASI Services LLC, or ASI, for a total purchase consideration of $11.2 million. The transaction was accounted for as a business combination under the acquisition method. ASI, headquartered in Cincinnati, OH, was a privately held corporation that primarily focused on providing inspection services for off-lease vehicles to financial institutions. The acquisition of ASI enabled us to expand our position in the used vehicle industry and enhance our service offerings with dealers and commercial partners.
In the third quarter of 2021, we completed an acquisition of all of the outstanding shares of MAX Digital LLC, or MAX Digital, for approximately $60.0 million, net of cash acquired. The total purchase price was paid in cash. The transaction was accounted for using the acquisition method and, accordingly, the results of the acquired business have been included in our results of operations from the acquisition date. In connection with the acquisition, we incurred approximately $1.1 million of transaction costs. The acquisition of MAX Digital enabled us to expand our position in the used vehicle industry and enhance our service offerings with dealers and commercial partners.
Also during 2021, we completed other business combinations for total consideration of approximately $6.9 million, net of cash acquired. The transactions were accounted for using the acquisition method and, accordingly, the results of the acquired business have been included in our results of operations from the respective acquisition dates. These acquisitions enabled us to expand our position in the used vehicle industry and enhance our service offerings between dealers and commercial partners.
During the first quarter of 2022, we completed an acquisition of Monk SAS for total consideration of approximately $18.6 million, net of cash acquired and expected working capital settlements. The transaction was accounted for using the acquisition method and, accordingly, the results of the acquired business have been included in our results of operations from the acquisition date. The acquisition of Monk enables the Company to enhance its service offerings and inspection capabilities for dealers and commercial partners.
Seasonality
The volume of vehicles sold through our auctions generally fluctuates from quarter to quarter. This seasonality is caused by several factors, including holidays, weather, the seasonality of the retail market for used vehicles and the timing of federal tax returns, which affects the demand side of the auction industry. As a result, revenue and operating expenses related to volume will fluctuate accordingly on a quarterly basis. In the fourth quarter, we typically experience lower used vehicle auction volume as well as additional costs associated with the holidays. Seasonally depressed used vehicle auction volume typically continues during the winter months through the beginning part of the first quarter. Typical seasonality trends may not be observed in periods where other external factors more significantly impact the industry.
62
Critical Accounting Estimates
We believe that the following accounting policies involve a high degree of judgement and complexity. Accordingly, these are the policies we believe are the most critical to aid in fully understanding and evaluating our consolidated financial condition and results of our operations. See Note 1 to our consolidated financial statements appearing elsewhere in this Annual Report on Form 10-K for a description of our other significant accounting policies. The preparation of our consolidated financial statements in conformity with GAAP requires us to make estimates and judgments that affect the amounts reported in those financial statements and accompanying notes. Although we believe that the estimates we use are reasonable, due to the inherent uncertainty involved in making those estimates, actual results reported in future periods could differ from those estimates.
Revenue Recognition
We generate revenue from contracts with customers. Revenue is recognized when control of the promised services is transferred to customers in an amount that reflects the consideration that we expect to receive in exchange for those services. Determining whether performance obligations should be accounted for separately or combined may require significant judgment. For each performance obligation within a contract, we evaluate whether we act as the principal or as an agent. When we act as the principal, revenue is recognized in the gross amount of the consideration received from the customer recognized at the point in time the services are completed. When we act as the agent, revenue is recognized net of the consideration due to a third party at the point in time when the services are provided.
In contracts with multiple performance obligations, we allocate the transaction price to each distinct performance obligation proportionately based on the estimated stand-alone selling price, or SSP, of each performance obligation. We use an observable price to determine the SSP for each performance obligation. Where observable prices are not available, an expected cost-plus margin approach is used. We then determine how the services are transferred to the customer to determine the timing of revenue recognition.
From time to time we provide promotions and incentives to buyers and sellers in various forms including discounts on fees, credits and rebates. Promotions and incentives which are consideration payable to a customer are recognized as a reduction of revenue when revenue is recognized.
Commissions paid to sales representatives and related payroll taxes are considered costs to obtain a contract. Financial Accounting Standard Board Accounting Standards Codification, or ASC, Topic 340, Other Assets and Deferred Costs, requires costs to obtain a contract with a customer within the scope of Accounting Standards Update No. 606, Revenue from Contracts with Customers, or ASC 606, to be capitalized and amortized over the period of benefit. We have elected the practical expedient available under ASC 340-40-25-4 to immediately expense the incremental cost of obtaining a contract when the underlying related asset would have been amortized over one year or less.
We have utilized the practical expedient available under ASC 606-10-50-14 and do not disclose the value of unsatisfied performance obligations for contracts with an original expected length of one year or less.
General Guarantees
We provide certain guarantees to Sellers in the marketplace in the ordinary course of business, which are accounted for under ASC 460, Guarantees, or ASC 460, as a general guarantee.
Vehicle Condition Guarantees—We offer guarantees to sellers in qualifying situations where we performed a vehicle inspection and prepared the vehicle condition report. The guarantee provides us with the right to retain proceeds from the subsequent liquidation of the vehicle covered under the guarantee. The fair value of vehicle condition guarantees issued is estimated based on historical results and other qualitative factors. The vehicle condition guarantee revenue is recognized on the earlier of the guarantee expiration date or the guarantee settlement date.
63
Other Price Guarantees—We provide sellers with a price guarantee for vehicles to be sold on the marketplace from time to time. If a vehicle sells below the guaranteed price, then we are responsible for paying the Seller the difference between the guaranteed price and the final sale price. The term of the guarantee is typically less than one week.
Internal-Use Software Costs
We capitalize internal-use software costs during the application development stage. Costs related to preliminary project activities and post implementation activities are expensed as incurred. This software is amortized on a straight-line basis over its estimated useful life, generally three years. We evaluate the useful lives of these assets on an annual basis, or more frequently when warranted.
Goodwill and Intangible Assets
Goodwill represents the excess of the aggregate purchase price paid over the fair value of the net tangible and intangible assets acquired. Intangible assets that are not considered to have an indefinite useful life are amortized over their useful lives. We evaluate the estimated remaining useful lives of purchased intangible assets and whether events or changes in circumstances warrant a revision to the remaining period of amortization. Goodwill is not amortized, but rather is subject to an impairment test.
We evaluate goodwill for impairment annually as one reporting unit on October 1 or more frequently when an event occurs or circumstances change that indicates the carrying value may not be recoverable. Our policy is to first perform a qualitative assessment to determine whether it is more likely or not that the reporting unit’s carrying value is less than its fair value, indicating the potential for goodwill impairment. If the reporting unit fails the qualitative test, then we proceed with a quantitative test. We then determine whether the reporting unit fair value is less than its carrying amount, and if it is, we recognize a goodwill impairment equal to the difference between the carrying amount of the reporting unit and its fair value, not to exceed the carrying amount of goodwill.
Recently Adopted Accounting Pronouncements
For information on recently issued accounting pronouncements, refer to Note 1. Nature of Business and Summary of Significant Accounting Policies in our consolidated financial statements included elsewhere in this Annual Report on Form 10-K.
64
Item 7A. Quantitative and Qualitative Disclosures About Market Risk.
We are exposed to market risk in the ordinary course of our business. Market risk represents the risk of loss that may impact our financial condition due to adverse changes in financial market prices and rates. Our market risk exposure is primarily the result of fluctuations in interest rates.
Interest Rate Risk
We had cash and cash equivalents of $280.8 million as of December 31, 2022, which consisted of interest-bearing investments with maturities of three months or less. Interest-earning instruments carry a degree of interest rate risk. We do not enter into investments for trading or speculative purposes and have not used any derivative financial instruments to manage our interest rate risk exposure. We had borrowings from banks of $75.5 million as of December 31, 2022. The interest rate paid on these borrowings is variable, indexed to LIBOR or, with respect to the 2021 Revolver, a replacement rate established in accordance with the terms of the credit agreement for the 2021 Revolver. A hypothetical 10% change in interest rates would not result in a material impact on our consolidated financial statements.
65
Item 8. Financial Statements and Supplementary Data.
66
Report of Independent Registered Public Accounting Firm
To the Shareholders and the Board of Directors of ACV Auctions Inc.
Opinion on the Financial Statements
We have audited the accompanying consolidated balance sheets of ACV Auctions Inc. (the Company) as of December 31, 2022 and 2021, the related consolidated statements of operations, comprehensive loss, changes in convertible preferred stock and stockholders’ equity (deficit) and cash flows for each of the three years in the period ended December 31, 2022, and the related notes (collectively referred to as the “consolidated financial statements”). In our opinion, the consolidated financial statements present fairly, in all material respects, the financial position of the Company at December 31, 2022 and 2021, and the results of its operations and its cash flows for each of the three years in the period ended December 31, 2022, in conformity with U.S. generally accepted accounting principles.
We also have audited, in accordance with the standards of the Public Company Accounting Oversight Board (United States) (PCAOB), the Company's internal control over financial reporting as of December 31, 2022, based on criteria established in Internal Control-Integrated Framework issued by the Committee of Sponsoring Organizations of the Treadway Commission (2013 framework) and our report dated March 1, 2023, expressed an unqualified opinion thereon.
Basis for Opinion
These financial statements are the responsibility of the Company's management. Our responsibility is to express an opinion on the Company’s financial statements based on our audits. We are a public accounting firm registered with the PCAOB and are required to be independent with respect to the Company in accordance with the U.S. federal securities laws and the applicable rules and regulations of the Securities and Exchange Commission and the PCAOB.
We conducted our audits in accordance with the standards of the PCAOB. Those standards require that we plan and perform the audit to obtain reasonable assurance about whether the financial statements are free of material misstatement, whether due to error or fraud. Our audits included performing procedures to assess the risks of material misstatement of the financial statements, whether due to error or fraud, and performing procedures that respond to those risks. Such procedures included examining, on a test basis, evidence regarding the amounts and disclosures in the financial statements. Our audits also included evaluating the accounting principles used and significant estimates made by management, as well as evaluating the overall presentation of the financial statements. We believe that our audits provide a reasonable basis for our opinion.
Critical Audit Matter
The critical audit matter communicated below is a matter arising from the current period audit of the financial statements that was communicated or required to be communicated to the audit committee and that: (1) relates to accounts or disclosures that are material to the financial statements and (2) involved our especially challenging, subjective or complex judgments. The communication of the critical audit matter does not alter in any way our opinion on the consolidated financial statements, taken as a whole, and we are not, by communicating the critical audit matter below, providing a separate opinion on the critical audit matter or on the account or disclosure to which it relates.
67
|
|
Capitalized internal-use software development costs
|
Description of the Matter |
|
As described in Note 1 to the consolidated financial statements, the Company capitalizes internal-use software costs during the application development stage of its software projects. The Company’s consolidated internal use software costs totaled $36.9 million, net as of December 31, 2022.
Management applies significant judgment to estimate the capitalizable cost of its projects, specifically as it relates to the nature and amount of time incurred by developers on projects in the application stage. Likewise, there is a high degree of auditor judgment, subjectivity and effort applied in performing procedures and evaluating management’s determination of capitalized costs, including the assessment of management’s estimate of the amount of capitalizable labor cost incurred by developers.
|
How We Addressed the Matter in Our Audit |
|
We obtained an understanding, evaluated the design and tested the operating effectiveness of controls over the Company’s internal use software cost and capitalized software development processes, including testing controls over management’s estimation of the labor cost capitalized.
To test the amount of internal-use software costs capitalized, we performed audit procedures that included, among others, confirming with engineers and inquiring of project managers regarding the nature of the costs, the stage of the project, and the time devoted to capitalizable activities for a sample of projects. We also inspected underlying documentation and tested the data supporting the nature and amount of labor cost capitalized. |
/s/
We have served as the Company’s auditor since 2018.
New York, NY
March 1, 2023
68
Report of Independent Registered Public Accounting Firm
To the Shareholders and the Board of Directors of ACV Auctions Inc.
Opinion on Internal Control over Financial Reporting
We have audited ACV Auctions Inc.’s internal control over financial reporting as of December 31, 2022, based on criteria established in Internal Control-Integrated Framework issued by the Committee of Sponsoring Organizations of the Treadway Commission (2013 framework), (the COSO criteria). In our opinion, ACV Auctions Inc. (the Company) maintained, in all material respects, effective internal control over financial reporting as of December 31, 2022, based on the COSO criteria.
We also have audited, in accordance with the standards of the Public Company Accounting Oversight Board (United States) (PCAOB), the consolidated balance sheets of the Company as of December 31, 2022 and 2021, the related consolidated statements of operations, comprehensive loss, changes in convertible preferred stock and stockholders’ equity (deficit) and cash flows for each of the three years in the period ended December 31, 2022, and the related notes and our report dated March 1, 2023 expressed an unqualified opinion thereon.
Basis for Opinion
The Company’s management is responsible for maintaining effective internal control over financial reporting and for its assessment of the effectiveness of internal control over financial reporting included in the accompanying Management’s Report on Internal Control Over Financial Reporting. Our responsibility is to express an opinion on the Company’s internal control over financial reporting based on our audit. We are a public accounting firm registered with the PCAOB and are required to be independent with respect to the Company in accordance with the U.S. federal securities laws and the applicable rules and regulations of the Securities and Exchange Commission and the PCAOB.
We conducted our audit in accordance with the standards of the PCAOB. Those standards require that we plan and perform the audit to obtain reasonable assurance about whether effective internal control over financial reporting was maintained in all material respects.
Our audit included obtaining an understanding of internal control over financial reporting, assessing the risk that a material weakness exists, testing and evaluating the design and operating effectiveness of internal control based on the assessed risk, and performing such other procedures as we considered necessary in the circumstances. We believe that our audit provides a reasonable basis for our opinion.
Definition and Limitations of Internal Control Over Financial Reporting
A company’s internal control over financial reporting is a process designed to provide reasonable assurance regarding the reliability of financial reporting and the preparation of financial statements for external purposes in accordance with generally accepted accounting principles. A company’s internal control over financial reporting includes those policies and procedures that (1) pertain to the maintenance of records that, in reasonable detail, accurately and fairly reflect the transactions and dispositions of the assets of the company; (2) provide reasonable assurance that transactions are recorded as necessary to permit preparation of financial statements in accordance with generally accepted accounting principles, and that receipts and expenditures of the company are being made only in accordance with authorizations of management and directors of the company; and (3) provide reasonable assurance regarding prevention or timely detection of unauthorized acquisition, use, or disposition of the company’s assets that could have a material effect on the financial statements.
Because of its inherent limitations, internal control over financial reporting may not prevent or detect misstatements. Also, projections of any evaluation of effectiveness to future periods are subject to the risk that controls may become inadequate because of changes in conditions, or that the degree of compliance with the policies or procedures may deteriorate.
/s/ Ernst & Young LLP
March 1, 2023
69
ACV AUCTIONS INC.
CONSOLIDATED STATEMENTS OF OPERATIONS
(in thousands, except per share data)
|
Year ended December 31, |
|
|||||||||
|
2022 |
|
|
2021 |
|
|
2020 |
|
|||
Revenue: |
|
|
|
|
|
|
|
|
|||
Marketplace and service revenue |
$ |
|
|
$ |
|
|
$ |
|
|||
Customer assurance revenue |
|
|
|
|
|
|
|
|
|||
Total revenue |
|
|
|
|
|
|
|
|
|||
Operating expenses: |
|
|
|
|
|
|
|
|
|||
Marketplace and service cost of revenue |
|
|
|
|
|
|
|
|
|||
Customer assurance cost of revenue |
|
|
|
|
|
|
|
|
|||
Operations and technology |
|
|
|
|
|
|
|
|
|||
Selling, general, and administrative |
|
|
|
|
|
|
|
|
|||
Depreciation and amortization |
|
|
|
|
|
|
|
|
|||
Total operating expenses |
|
|
|
|
|
|
|
|
|||
Loss from operations |
|
( |
) |
|
|
( |
) |
|
|
( |
) |
Other income (expense): |
|
|
|
|
|
|
|
|
|||
Interest income |
|
|
|
|
|
|
|
|
|||
Interest expense |
|
( |
) |
|
|
( |
) |
|
|
( |
) |
Total other income (expense) |
|
|
|
|
( |
) |
|
|
|
||
Loss before income taxes |
|
( |
) |
|
|
( |
) |
|
|
( |
) |
Provision for income taxes |
|
|
|
|
|
|
|
|
|||
Net income (loss) |
$ |
( |
) |
|
$ |
( |
) |
|
$ |
( |
) |
Weighted-average shares - basic and diluted |
|
|
|
|
|
|
|
|
|||
Net loss per share - basic and diluted |
$ |
( |
) |
|
$ |
( |
) |
|
$ |
( |
) |
The accompanying notes are an integral part of these consolidated financial statements.
70
ACV AUCTIONS INC.
CONSOLIDATED STATEMENTS OF COMPREHENSIVE LOSS
(in thousands)
|
Year ended December 31, |
|
|||||||||
|
2022 |
|
|
2021 |
|
|
2020 |
|
|||
Net income (loss) |
$ |
( |
) |
|
$ |
( |
) |
|
$ |
( |
) |
Other comprehensive loss: |
|
|
|
|
|
|
|
|
|||
Net unrealized gains (losses) on available-for-sale |
|
( |
) |
|
|
( |
) |
|
|
|
|
Foreign currency translation gain (loss) |
|
( |
) |
|
|
|
|
|
( |
) |
|
Comprehensive loss |
$ |
( |
) |
|
$ |
( |
) |
|
$ |
( |
) |
The accompanying notes are an integral part of these consolidated financial statements.
71
ACV AUCTIONS INC.
CONSOLIDATED BALANCE SHEETS
(in thousands, except share data)
|
|
December 31, |
|
|
December 31, 2021 |
|
||
Assets |
|
|
|
|
|
|
||
Current Assets : |
|
|
|
|
|
|
||
Cash and cash equivalents |
|
$ |
|
|
$ |
|
||
Marketable securities |
|
|
|
|
|
|
||
Trade receivables (net of allowance of $ |
|
|
|
|
|
|
||
Finance receivables (net of allowance of $ |
|
|
|
|
|
|
||
Other current assets |
|
|
|
|
|
|
||
Total current assets |
|
|
|
|
|
|
||
Property and equipment (net of accumulated depreciation of $ |
|
|
|
|
|
|
||
Goodwill |
|
|
|
|
|
|
||
Acquired intangible assets (net of amortization of $ |
|
|
|
|
|
|
||
Internal-use software costs (net of amortization of $ |
|
|
|
|
|
|
||
Other assets |
|
|
|
|
|
|
||
Total assets |
|
|
|
|
|
|
||
Liabilities and Stockholders' Equity |
|
|
|
|
|
|
||
Current Liabilities : |
|
|
|
|
|
|
||
Accounts payable |
|
|
|
|
|
|
||
Accrued payroll |
|
|
|
|
|
|
||
Accrued other liabilities |
|
|
|
|
|
|
||
Total current liabilities |
|
|
|
|
|
|
||
Long-term debt |
|
|
|
|
|
|
||
Other long-term liabilities |
|
|
|
|
|
|
||
Total liabilities |
|
$ |
|
|
$ |
|
||
|
|
|
|
|
|
|||
Stockholders' Equity: |
|
|
|
|
|
|
||
Preferred stock; $ |
|
|
|
|
|
|
||
Common stock - Class A; $ |
|
|
|
|
|
|
||
Common stock - Class B; $ |
|
|
|
|
|
|
||
Additional paid-in capital |
|
|
|
|
|
|
||
Accumulated deficit |
|
|
( |
) |
|
|
( |
) |
Accumulated other comprehensive loss |
|
|
( |
) |
|
|
( |
) |
Total stockholders' equity |
|
|
|
|
|
|
||
Total liabilities and stockholders' equity |
|
$ |
|
|
$ |
|
||
The accompanying notes are an integral part of these consolidated financial statements.
72
ACV AUCTIONS INC.
CONSOLIDATED STATEMENTS OF CHANGES IN CONVERTIBLE PREFERRED STOCK AND STOCKHOLDERS' EQUITY (DEFICIT)
(in thousands, except share data)
|
|
Convertible Preferred Stock |
|
|
|
Common Stock |
|
Common Class A |
|
Common Class B |
|
Additional |
|
|
|
Accumulated Other |
|
|
|
||||||||||||||||||||
|
|
|
|
|
|
|
|
|
|
|
|
|
|
|
|
|
|
|
|
Paid-In |
|
Accumulated |
|
Comprehensive |
|
|
|
||||||||||||
|
|
Shares |
|
Amount |
|
|
|
Shares |
|
Par Value |
|
Shares |
|
Par Value |
|
Shares |
|
Par Value |
|
Capital |
|
Deficit |
|
Loss (Income) |
|
Total |
|
||||||||||||
Balance, January 1 , 2020 |
|
|
|
$ |
|
|
|
|
|
$ |
|
|
|
$ |
|
|
|
$ |
|
$ |
|
$ |
( |
) |
$ |
( |
) |
$ |
( |
) |
|||||||||
Issuance of Series E-1 Preferred Stock, net of |
|
|
|
|
|
|
|
|
|
|
|
|
|
|
|
|
|
|
|
|
|
|
|
|
|
|
|
||||||||||||
Net loss |
|
|
|
|
|
|
|
|
|
|
|
|
|
|
|
|
|
|
|
|
|
|
( |
) |
|
|
|
( |
) |
||||||||||
Other comprehensive loss |
|
|
|
|
|
|
|
|
|
|
|
|
|
|
|
|
|
|
|
|
|
|
|
|
( |
) |
|
( |
) |
||||||||||
Stock-based compensation |
|
|
|
|
|
|
|
|
|
|
|
|
|
|
|
|
|
|
|
|
|
|
|
|
|
|
|
||||||||||||
Exercise of common stock options |
|
|
|
|
|
|
|
|
|
|
|
|
|
|
|
|
|
|
|
|
|
|
|
|
|
|
|
||||||||||||
Balance, December 31, 2020 |
|
|
|
$ |
|
|
|
|
|
$ |
|
|
|
$ |
|
|
|
$ |
|
$ |
|
$ |
( |
) |
$ |
( |
) |
$ |
( |
) |
|||||||||
Issuance of common stock in connection with |
|
|
|
|
|
|
|
|
|
|
|
|
|
|
|
|
|
|
|
|
|
|
|
|
|
|
|
||||||||||||
Conversion of redeemable convertible |
|
|
( |
) |
|
( | ) |
|
|
|
|
|
|
|
|
|
|
|
|
|
|
|
|
|
|
|
|
|
|
||||||||||
Sale of Class B common stock to underwriters |
|
|
|
|
|
|
|
|
|
|
|
|
|
|
|
|
( |
) |
|
( |
) |
|
|
|
|
|
|
|
|
||||||||||
Reclassification of common stock to Class B |
|
|
|
|
|
|
|
|
( |
) |
|
( |
) |
|
|
|
|
|
|
|
|
|
|
|
|
|
|
|
|
||||||||||
Conversion of Class B common stock to |
|
|
|
|
|
|
|
|
|
|
|
|
|
|
|
|
( |
) |
|
( |
) |
|
|
|
|
|
|
|
|
||||||||||
Net loss |
|
|
|
|
|
|
|
|
|
|
|
|
|
|
|
|
|
|
|
|
|
|
( |
) |
|
|
|
( |
) |
||||||||||
Other comprehensive income |
|
|
|
|
|
|
|
|
|
|
|
|
|
|
|
|
|
|
|
|
|
|
|
|
|
|
|
||||||||||||
Stock-based compensation |
|
|
|
|
|
|
|
|
|
|
|
|
|
|
|
|
|
|
|
|
|
|
|
|
|
|
|
||||||||||||
Exercise of common stock options |
|
|
|
|
|
|
|
|
|
|
|
|
|
|
|
|
|
|
|
|
|
|
|
|
|
|
|
||||||||||||
Vested restricted stock units |
|
|
|
|
|
|
|
|
|
|
|
|
|
|
|
|
|
|
|
|
( | ) |
|
|
|
|
|
( | ) |
||||||||||
TruePartners USA LLC acquisition |
|
|
|
|
|
|
|
|
|
|
|
|
|
|
|
|
|
|
|
|
|
|
|
|
|
|
|
||||||||||||
Balance, December 31, 2021 |
|
|
|
$ |
|
|
|
|
|
$ |
|
|
|
$ |
|
|
|
$ |
|
$ |
|
$ |
( |
) |
$ |
( |
) |
$ |
|
||||||||||
Conversion of Class B common |
|
|
|
|
|
|
|
|
|
|
|
|
|
|
|
|
( |
) |
|
( |
) |
|
|
|
|
|
|
|
- |
|
|||||||||
Net loss |
|
|
|
|
|
|
|
|
|
|
|
|
|
|
|
|
|
|
|
|
|
|
( |
) |
|
|
|
( |
) |
||||||||||
Other comprehensive loss |
|
|
|
|
|
|
|
|
|
|
|
|
|
|
|
|
|
|
|
|
|
|
|
|
( |
) |
|
( |
) |
||||||||||
Stock-based compensation |
|
|
|
|
|
|
|
|
|
|
|
|
|
|
|
|
|
|
|
|
|
|
|
|
|
|
|
||||||||||||
Exercise of common stock options |
|
|
|
|
|
|
|
|
|
|
|
|
|
|
|
|
|
|
|
|
|
|
|
|
|
|
|
||||||||||||
Vested restricted stock units |
|
|
|
|
|
|
|
|
|
|
|
|
|
|
|
|
|
|
|
|
( | ) |
|
|
|
|
|
( | ) |
||||||||||
Escrowed shares |
|
|
|
|
|
|
|
|
|
|
|
|
|
|
|
|
|
|
|
|
( |
) |
|
|
|
|
|
|
|||||||||||
Issuance of shares for employee |
|
|
|
|
|
|
|
|
|
|
|
|
|
|
|
|
|
|
|
|
|
|
|
|
|
|
|
||||||||||||
Balance, December 31, 2022 |
|
|
|
$ |
|
|
|
|
|
$ |
|
|
|
$ |
|
|
|
$ |
|
$ |
|
$ |
( | ) |
$ |
( |
) |
$ |
|
||||||||||
The accompanying notes are an integral part of these consolidated financial statements.
73
ACV AUCTIONS INC.
CONSOLIDATED STATEMENTS OF CASH FLOWS
(in thousands)
|
|
Year ended December 31, |
|
|||||||||
|
|
2022 |
|
|
2021 |
|
|
2020 |
|
|||
Cash Flows from Operating Activities |
|
|
|
|
|
|
|
|
|
|||
Net income (loss) |
|
$ |
( |
) |
|
$ |
( |
) |
|
$ |
( |
) |
Adjustments to reconcile net loss to net cash provided by (used in) operating activities: |
|
|
|
|
|
|
|
|
|
|||
Depreciation and amortization |
|
|
|
|
|
|
|
|
|
|||
Stock-based compensation expense, net of amounts capitalized |
|
|
|
|
|
|
|
|
|
|||
Provision for bad debt |
|
|
|
|
|
|
|
|
|
|||
(Gain) on contingent liabilities |
|
|
- |
|
|
|
|
|
|
( |
) |
|
Other non-cash, net |
|
|
( |
) |
|
|
|
|
|
|
||
Changes in operating assets and liabilities, net of effects from purchases of |
|
|
|
|
|
|
|
|
|
|||
Trade receivables |
|
|
|
|
|
( |
) |
|
|
( |
) |
|
Other current assets |
|
|
|
|
|
( |
) |
|
|
( |
) |
|
Accrued interest on marketable securities |
|
|
( |
) |
|
|
- |
|
|
|
- |
|
Accounts payable |
|
|
( |
) |
|
|
|
|
|
|
||
Accrued payroll |
|
|
( |
) |
|
|
|
|
|
|
||
Accrued other liabilities |
|
|
( |
) |
|
|
|
|
|
( |
) |
|
Other long-term liabilities |
|
|
( |
) |
|
|
( |
) |
|
|
|
|
Other assets |
|
|
( |
) |
|
|
( |
) |
|
|
( |
) |
Net cash provided by (used in) operating activities |
|
|
( |
) |
|
|
|
|
|
|
||
Cash Flows from Investing Activities |
|
|
|
|
|
|
|
|
|
|||
Net increase in finance receivables |
|
|
( |
) |
|
|
( |
) |
|
|
( |
) |
Purchases of property and equipment |
|
|
( |
) |
|
|
( |
) |
|
|
( |
) |
Capitalization of software costs |
|
|
( |
) |
|
|
( |
) |
|
|
( |
) |
Purchases of marketable securities |
|
|
( |
) |
|
|
( |
) |
|
|
|
|
Maturities and redemptions of marketable securities |
|
|
|
|
|
- |
|
|
|
- |
|
|
Acquisition of businesses (net of cash acquired) |
|
|
( |
) |
|
|
( |
) |
|
|
( |
) |
Net cash provided by (used in) investing activities |
|
|
( |
) |
|
|
( |
) |
|
|
( |
) |
Cash Flows from Financing Activities |
|
|
|
|
|
|
|
|
|
|||
Proceeds from issuance of common stock in connection with initial public offering, net |
|
|
|
|
|
|
|
|
|
|||
Proceeds from long term debt |
|
|
|
|
|
|
|
|
|
|||
Payments towards long term debt |
|
|
( |
) |
|
|
( |
) |
|
|
( |
) |
Proceeds from issuance of Series E1 preferred stock |
|
|
|
|
|
|
|
|
|
|||
Payments towards promissory note |
|
|
|
|
|
( |
) |
|
|
|
||
Proceeds from exercise of stock options |
|
|
|
|
|
|
|
|
|
|||
Payments for debt issuance and other financing costs |
|
|
|
|
|
( |
) |
|
|
( |
) |
|
Payment of RSU tax withholdings in exchange for common shares |
|
|
( | ) |
|
|
( | ) |
|
|
|
|
Proceeds from employee stock purchase plan |
|
|
|
|
|
- |
|
|
|
- |
|
|
Other financing activities, net |
|
|
|
|
|
|
|
|
( |
) |
||
Net cash provided by (used in) financing activities |
|
|
|
|
|
|
|
|
|
|||
Effect of exchange rate changes on cash, cash equivalents, and restricted cash |
|
|
( |
) |
|
|
|
|
|
|
||
Net increase (decrease) in cash, cash equivalents, and restricted cash |
|
|
( |
) |
|
|
|
|
|
|
||
Cash, cash equivalents, and restricted cash, beginning of period |
|
|
|
|
|
|
|
|
|
|||
Cash, cash equivalents, and restricted cash, end of period |
|
$ |
|
|
$ |
|
|
$ |
|
|||
Supplemental disclosure of cash flow information |
|
|
|
|
|
|
|
|
|
|||
Cash paid (received) during the period for: |
|
|
|
|
|
|
|
|
|
|||
Interest (income) expense |
|
$ |
( |
) |
|
$ |
|
|
$ |
|
||
Income taxes |
|
$ |
|
|
$ |
|
|
$ |
|
|||
Cash paid included in the measurement of operating lease liabilities |
|
$ |
|
|
$ |
|
|
$ |
|
|||
Non-cash investing and financing activities: |
|
|
|
|
|
|
|
|
|
|||
Stock-based compensation included in capitalized software development costs |
|
$ |
|
|
$ |
|
|
$ |
|
|||
Purchase of property and equipment and internal use software in accounts payable |
|
$ |
|
|
$ |
|
|
$ |
|
|||
74
The accompanying notes are an integral part of these consolidated financial statements.
75
ACV AUCTIONS INC.
NOTES TO CONSOLIDATED FINANCIAL STATEMENTS
Basis of Consolidation – The consolidated financial statements include the accounts of ACV Auctions Inc. and all of its subsidiaries. All intercompany balances and transactions have been eliminated in consolidation.
Basis of Preparation – The accompanying consolidated financial statements have been prepared in accordance with generally accepted accounting principles in the United States of America (“U.S. GAAP”). Any reference in these notes to applicable guidance is meant to refer to the authoritative U.S. GAAP as found in the Accounting Standards Codification (“ASC”) and Accounting Standards Update (“ASU”) of the Financial Accounting Standards Board (“FASB”).
Initial Public Offering – On March 26, 2021, the Company completed its initial public offering (“IPO”), in which the Company issued and sold
76
Prior to the IPO, deferred issuance costs, which consist of direct incremental legal, accounting, and consulting fees relating to the IPO, were capitalized in prepaid expenses and other current assets in the Consolidated Balance Sheets. Upon the consummation of the IPO, $
Emerging Growth Company Status – We became a large accelerated filer as of December 31, 2022 because the market value of our Class A common stock held by non-affiliates exceeded $
Segment Reporting – Operating segments are identified as components of an enterprise for which separate discrete financial information is available for evaluation by the Company’s Chief Operating Decision Maker (“CODM”) in making decisions regarding resource allocation and assessing performance. The CODM is the Chief Executive Officer (“CEO”). The CEO reviews the financial information presented on a consolidated basis for purposes of allocating resources and evaluating the Company’s financial performance. Accordingly, the Company has determined that it operates in a single reporting segment.
Cash and Cash Equivalents – The Company considers all highly liquid instruments originally purchased with a maturity of three months or less to be cash equivalents. Included within Cash and cash equivalents on the Consolidated Balance Sheets are restricted cash balances of $
Receivables – Trade receivables include the price of the auctioned vehicle and fees due for services. Trade receivables are recorded net of the allowance for doubtful receivables at net realizable value. Trade receivables are due either upon the close of an auction, or upon the delivery of title from the Seller to the Company, depending on the terms agreed with the customer.
Finance receivables represent amounts borrowed by Buyers selecting to finance the purchase of an auctioned vehicle and related fees and are collateralized by the auctioned vehicle. Finance receivables are recorded net of the allowance for credit losses. Finance receivables are due upon maturity or upon the subsequent sale of the purchased vehicle, whichever comes first. Finance receivables are placed on nonaccrual status when principal or interest becomes delinquent, which is generally 31 days past due unless management determines that the finance receivable status clearly warrants other treatment. Nonaccrual finance receivables are returned to accrual status when all past due principal and interest payments have been paid by the borrower. While on nonaccrual status, interest is not recognized into income. Upon management’s determination of uncollectibility, such accounts are written off against the allowance for doubtful receivables.
For trade receivables and finance receivables, management considers factors such as age of the receivable, customer history, existing economic conditions, overall portfolio credit quality, and reasonable and supportable expectations about the future to estimate an allowance for doubtful receivables. Upon management’s determination of uncollectibility, such accounts are written off against the allowance for doubtful receivables.
Property and Equipment, net – Property and equipment is stated at cost, net of accumulated depreciation. Improvements are generally capitalized. The costs of maintenance and repairs are charged to expense as incurred. Depreciation is computed using the straight-line method over the approximate economic useful lives of the assets. Depreciation of the cost of improvements to leased properties is made using the straight-line method based on the shorter of the estimated useful life or applicable lease period.
Computer equipment and devices |
|
Inspection and trade show equipment |
|
Furniture and fixtures |
|
Leasehold improvements |
77
Internal-Use Software Costs, net – The Company capitalizes its internal-use software costs during the application development stage. Costs related to preliminary project activities and post implementation activities are expensed as incurred. This software is amortized, once it is placed into service, on a straight-line basis over its estimated useful life, generally
Leases – The Company determines if an arrangement is a lease at inception. Operating leases with a term greater than twelve months are included in Other assets and Other long-term liabilities in our Consolidated Balance Sheets. The Company has elected to account for operating leases with a term less than twelve months to be expensed as incurred. Short-term operating lease expenses were
Goodwill & Acquired Intangible Assets, net – Goodwill represents the excess of the aggregate purchase price paid over the fair value of the net tangible and intangible assets acquired. Intangible assets that are not considered to have an indefinite useful life are amortized over their useful lives. The Company evaluates the estimated remaining useful lives of acquired intangible assets and whether events or changes in circumstances warrant a revision to the remaining period of amortization. Goodwill is not amortized, but rather is subject to an impairment test.
The Company evaluates goodwill for impairment annually as one singular reporting unit on October 1 or more frequently when an event occurs or circumstances change that indicate the carrying value may not be recoverable. The Company’s policy is to first perform a qualitative assessment to determine whether it was more likely than not that the reporting unit's carrying value is less than its fair value, indicating the potential for goodwill impairment. If the reporting unit fails the qualitative test, then the Company proceeds with a quantitative test. The Company then determines whether the reporting unit fair value is less than its carrying amount, and if it is, the Company recognizes a goodwill impairment equal to the difference between the carrying amount of the reporting unit and its fair value, not to exceed the carrying amount of goodwill. The Company did
Impairment of Long-Lived Assets – The Company periodically reviews long-lived assets, which consist of its property and equipment, internal-use software and other finite-lived intangible assets, for impairment whenever events or changes in circumstances indicate that the carrying amount of an asset is impaired or the estimated useful lives are no longer appropriate. If indicators of impairment exist and the undiscounted projected cash flows associated with such assets are less than the carrying amount of the asset, an impairment loss is recorded to write the assets down to their estimated fair values. The Company did
Commitments and Contingencies – The Company may be involved in disputes or regulatory inquiries that arise in the ordinary course of business. When the Company determines that a loss is both probable and reasonably estimable, a liability is recorded and disclosed if the amount is material to the consolidated financial statements taken as a whole. When a material loss contingency is only reasonably possible, the Company does not record a liability, but instead discloses the nature and the amount of the claim, and an estimate of the loss or range of loss, if such an estimate can reasonably be made. Accruals for contingencies including litigation are included in Accrued other liabilities at undiscounted amounts. These accruals are adjusted periodically as additional information becomes available. If the amount of an actual loss is greater than the amount accrued, this could have an adverse impact on our operating results in that period.
78
Revenue Recognition – The Company generates revenue from contracts with customers. Revenue is recognized when control of the promised services is transferred to customers in an amount that reflects the consideration that the Company expects to receive in exchange for those services. Determining whether performance obligations should be accounted for separately or combined may require significant judgment. For each performance obligation within a contract, the Company evaluates whether it acts as the principal or as an agent. When the Company acts as the principal, revenue is recognized in the gross amount of the consideration received from the customer at the point in time the services are completed. When the Company acts as the agent, revenue is recognized net of the consideration due to a third party at the point in time when the services are provided.
In contracts with multiple performance obligations, the Company allocates the transaction price to each distinct performance obligation proportionately based on the estimated stand-alone selling price (“SSP”) of each performance obligation. The Company uses an observable price to determine the SSP for each performance obligation. Where observable prices are not available, an expected cost-plus margin approach is used. The Company then determines how the services are transferred to the customer to determine the timing of revenue recognition.
From time to time we provide promotions and incentives to Buyers and Sellers in various forms including discounts on fees, credits and rebates. Promotions and incentives which are consideration payable to a customer are recognized as a reduction of revenue when revenue is recognized.
Commissions paid to sales representatives and related payroll taxes are considered costs to obtain a contract. ASC 340, Other Assets and Deferred Costs, requires costs to obtain a contract with a customer within the scope of ASC 606 to be capitalized and amortized over the period of benefit. The Company has elected the practical expedient available under ASC 340-40-25-4 to immediately expense the incremental cost of obtaining a contract when the underlying related asset would have been amortized over one year or less.
The Company has utilized the practical expedient available under ASC 606-10-50-14 and does not disclose the value of unsatisfied performance obligations for contracts with an original expected length of one year or less. The Company has also utilized the practical expedient available under ASC 606-10-32-2A to exclude from revenue all taxes assessed by a governmental authority, including sales, use and excise taxes, that are both imposed on and concurrent with a specific revenue-producing transaction and collected from a customer.
Marketplace and service revenue – Marketplace and service revenue consists principally of revenues earned from facilitating an auction on the Marketplace and arranging for the transportation of vehicles purchased on the Marketplace to the Buyer. In the course of facilitating an auction on the Marketplace, the Seller may elect for the Company to perform a wholesale auction inspection of the vehicle. Marketplace and service revenue also consists of data services that offer insights into the condition and value of used vehicles for transactions both on and off our Marketplace, by providing the customer an inspection of the vehicle and an inspection report and other software related services.
Revenue earned from facilitating a vehicle auction through the Marketplace is recognized at a point in time when the vehicle is sold. The Company acts as an agent when facilitating a vehicle auction through the Marketplace. Accordingly, auction and related fees charged to the Buyer and Seller are reported as revenue on a net basis, excluding the price of the auctioned vehicle in the transaction.
Revenue from transportation services is recognized over time as delivery is completed. In providing its transportation services, the Company leverages its network of third-party transportation carriers and arranges for the transportation of the vehicle to the Buyer. The Company is the principal for transportation services. Transportation fees charged to the Buyer are reported on a gross basis.
Data services revenue is recognized at a point in time when the vehicle inspection and report is completed and delivered to the customer. The Company also generates data services revenue from software related services. Subscription revenue is recognized on a ratable basis over the contractual subscription term of the arrangement, beginning on the date that our services are made available to the customer. Implementation and training revenue is recognized over time as services are transferred to our customers.
79
Timing of revenue recognition may differ from the timing of payment from customers. Accounts receivable represents amounts invoiced, which include the price of the auctioned vehicle and related fees charged to a Buyer, where the Company has the unconditional right to payment.
The Company offers short-term financing to eligible customers purchasing vehicles through the Marketplace. These financing fees are accounted for under ASC 310-20, Nonrefundable Fees and Other Costs, and therefore are not subject to evaluation under ASC 606. Financing fees are recognized ratably over the duration of the financing arrangement.
Customer assurance revenue – Customer assurance revenue represents the implied premium received for certain guarantees. Refer to Note 8 for additional information.
Marketplace and service cost of revenue – Marketplace and service cost of revenue consists of third-party transportation carrier costs, titles shipping costs, customer support, website hosting costs, inspection costs related to data services, and various other costs. These costs include personnel-related costs and related stock-based compensation expenses.
Customer assurance cost of revenue – Customer assurance cost of revenue consists of the costs related to satisfying claims against guarantees. Refer to Note 8 for additional information.
Operations and technology – Operations and technology costs consist of expenses for wholesale auction inspections, personnel costs related to payments and titles processing, transportation processing, product and engineering, and other general operations and technology expenses. These costs include personnel-related costs and related stock-based compensation expenses.
Selling, general and administrative – Selling, general and administrative expense consists of costs resulting from sales, accounting, finance, legal, marketing, human resources, executive, and other administrative activities. These costs include personnel-related costs, related stock-based compensation expenses, and legal and other professional services expenses.
Also included in selling, general and administrative is advertising and marketing costs to promote our services, which are expensed as incurred. Advertising and marketing expenses were $
Depreciation and amortization – Depreciation and amortization expense consists of depreciation of fixed assets, and amortization of acquired intangible assets and internal-use software. Amortization of implementation costs for hosted software arrangements is included within Operations and technology and Selling, general, and administrative, as applicable, consistently with the classification of the related hosted software fees.
|
2022 |
|
2021 |
|
2020 |
|
|||
Operations and technology |
$ |
|
$ |
|
$ |
|
|||
Selling, general, and administrative |
|
|
|
|
|
|
|||
Stock-Based Compensation – The Company uses the fair value recognition provisions of ASC 718, Compensation – Stock Compensation. The estimated fair value of each Common Stock option award or employee stock purchase right is calculated on the date of grant using the Black-Scholes option pricing model. Application of the Black-Scholes option pricing model requires significant judgment, and involves the use of subjective assumptions including:
80
Expected Term — The expected term represents the period that the stock-based awards are expected to be outstanding. As the Company does not have sufficient historical experience for determining the expected term of the stock option awards granted, the simplified method was used to determine the expected term for awards issued to employees. With respect to employee stock purchase rights, the Company uses a term assumption consistent with the purchase period.
Risk-Free Interest Rate — The risk-free interest rate is based on the U.S. Treasury yield curve in effect at the date of grant for zero-coupon U.S. Treasury constant maturity notes with terms approximately equal to the stock-based awards’ or employee stock purchase rights' expected term.
Expected Volatility — Expected volatility is estimated based upon the historical volatility of the daily closing prices of the Company's Class A common stock, which is traded publicly on the Nasdaq Global Select Market, over periods that correlate with the expected terms of the awards granted.
Dividend Rate — The expected dividend rate is zero as the Company has not paid and does not anticipate paying any dividends in the foreseeable future.
Fair Value of Common Stock — Prior to the Company's IPO, the Company estimated the fair value of common stock. The Board of Directors, with input from management considered numerous objective and subjective factors to determine the fair value of the Company’s common stock at each meeting in which awards were approved.
Valuations of the common stock performed by a third-party valuation specialist are in accordance with the guidance outlined in the American Institute of Certified Public Accountants’ Accounting and Valuation Guide, Valuation of Privately Held Company Equity Securities Issued as Compensation. Factors taken into consideration in assessing the fair value of the Company’s common stock include, but are not limited to: (i) the results of contemporaneous independent third-party valuations of the Company’s common stock; (ii) the prices, rights, preferences, and privileges of the Company’s convertible preferred stock relative to those of its common stock; (iii) the likelihood and timing of achieving a qualifying event, such as an IPO or sale of the Company given prevailing market conditions; (iv) actual operating and financial results; and (v) precedent transactions involving the Company’s shares.
Subsequent to the IPO, the fair value of the underlying common stock is determined by the closing price, on the date of grant, of the Company's Class A common stock.
The Company measures all stock options and other stock-based awards granted to employees, directors, consultants and other nonemployees based on the fair value on the date of the grant. The options vest based on a graded scale over the stated vesting period, and compensation expense is recognized based on their grant date fair value on a straight-line basis over the requisite service period. Forfeitures are recognized as they occur.
The fair value of restricted stock units are determined based on the closing price of the Company’s Class A common stock on the grant date. The awards and units vest over time and compensation expense is recognized based on their grant fair value ratably over the requisite service period.
The Company classifies stock-based compensation expense in its Consolidated Statements of Operations in the same way the payroll costs or service payments are classified for the related stock-based award recipient.
Income Taxes – The Company accounts for income taxes in accordance with ASC 740, Income Taxes. This standard requires, among other things, recognition of deferred tax assets and liabilities for future tax consequences, measured by enacted rates attributable to temporary differences between financial statement and income tax bases of assets and liabilities, and net operating loss and tax credit carryforwards to the extent that realization of such benefits is more likely than not.
81
Foreign Currency – The functional currencies of the Company’s Canadian and French subsidiaries are the applicable local currency. The translation of the applicable foreign currency into U.S. dollars is performed for assets and liabilities using current exchange rates in effect at the balance sheet date, and for revenue and expense activity using the applicable month’s average exchange rates. Foreign currency translation gains and losses are included as a component of the Consolidated Statements of Comprehensive Loss. Foreign currency transaction gains and losses are reported within the Other income financial statement line item of the Consolidated Statements of Operations.
Net Loss Per Share Attributable to Common Stockholders – Basic net loss per share attributable to common stockholders is computed by dividing net loss attributable to common stockholders by the weighted-average number of shares of common stock outstanding for the period.
Diluted net loss per share attributable to common stockholders is computed by dividing net income (loss) attributable to common stockholders by the weighted-average number of shares of common stock outstanding for the period, adjusted to reflect potentially dilutive securities using the treasury stock method for the purchase of the Company's common stock, stock option awards and restricted stock units. Due to the Company’s loss from continuing operations, net of income taxes: (i) convertible preferred stock, (ii) unvested restricted stock and other awards, (iii) stock options, and (iv) shares subject to the employee stock purchase plan, were not included in the computation of diluted net loss per share attributable to common stockholders, as the effects would be anti-dilutive. Accordingly, basic and diluted net loss per share attributable to common stockholders are equal for the years presented.
Fair Value Measurements and Financial Instruments – Fair value accounting is applied for all financial assets and liabilities and non-financial assets and liabilities that are recognized or disclosed at fair value in the consolidated financial statements on a recurring basis (at least annually). Fair value is defined as the price that would be received to sell an asset or paid to transfer a liability in an orderly transaction between market participants at the measurement date.
Assets and liabilities recorded at fair value in the consolidated financial statements are categorized based upon the level of judgment associated with the inputs used to measure their fair value. Hierarchical levels, which are directly related to the amount of subjectivity, associated with the inputs to the valuation of these assets or liabilities are as follows:
Level 1: Observable inputs such as quoted prices in active markets for identical assets and liabilities.
Level 2: Inputs other than the quoted prices in active markets that are observable either directly or indirectly.
Level 3: Unobservable inputs in which there is little or no market data which require the Company to develop its own assumptions.
The Company’s financial instruments primarily consist of cash and cash equivalents, debt securities, trade and finance accounts receivable and accounts payable whose carrying values approximate fair value due to the short-term nature of those instruments.
Reclassification – The Company reclassified accrued interest on marketable securities from Other current assets to Marketable securities as of December 31, 2021 on the Consolidated Balance Sheets, to conform with the current period presentation. The reclassification is a change from one acceptable presentation to another acceptable presentation with no impact to reported current assets.
82
Accounting Pronouncements – The following table provides a description of accounting standards that were adopted by the Company as well as standards that are not yet adopted that could have an impact to the consolidated financial statements upon adoption.
Accounting Standard Update |
Description |
Required date of adoption |
Effect on consolidated financial statements |
|
|||
Measurement of Credit Losses on Financial Instruments (ASU 2016-13, 2018-19, 2019-04, 2019-05, 2019-10, 2019-11, 2020-02, 2020-03) |
The guidance changes the methodology for measuring credit losses on financial instruments and the timing of when such losses are recorded. |
December 31, 2022
|
The adoption did not have a material impact on the consolidated financial statements. |
The Company reviewed all other recently issued accounting standards and concluded that they were not applicable to the consolidated financial statements.
Financial instruments that potentially subject the company to credit risk primarily consist of cash and cash equivalents, short-term high credit-quality money market funds at financial institutions that management believes are of high credit quality, and marketable investment securities with investment-grade ratings. The Company has not realized any losses on such amounts.
Due to the nature of our business, substantially all revenue is earned and trade and finance receivables are due from dealerships and commercial partners. No individual customer accounted for more than
83
The following is a summary of available-for-sale marketable securities, as of December 31, 2022 and 2021, respectively (in thousands):
|
December 31, 2022 |
|
|||||||||||||
|
Amortized Cost |
|
|
Unrealized Gain |
|
|
Unrealized Losses |
|
|
Fair Value |
|
||||
Marketable securities: |
|
|
|
|
|
|
|
|
|
|
|
||||
Corporate securities (1) |
$ |
|
|
$ |
|
|
$ |
( |
) |
|
$ |
|
|||
U.S. treasury and agency securities |
|
|
|
|
|
|
|
( |
) |
|
|
|
|||
Total marketable securities |
$ |
|
|
$ |
|
|
$ |
( |
) |
|
$ |
|
|||
(1) Comprised primarily of corporate bonds and commercial paper |
|
|
|
|
|
|
|
||||||||
|
|
|
|
|
|
|
|
|
|
|
|
||||
|
December 31, 2021 |
|
|||||||||||||
|
Amortized Cost |
|
|
Unrealized Gain |
|
|
Unrealized Losses |
|
|
Fair Value |
|
||||
Marketable securities: |
|
|
|
|
|
|
|
|
|
|
|
||||
Corporate securities (1) |
$ |
|
|
$ |
|
|
$ |
( |
) |
|
$ |
|
|||
U.S. treasury and agency securities |
|
|
|
|
|
|
|
( |
) |
|
|
|
|||
Total marketable securities |
$ |
|
|
$ |
|
|
$ |
( |
) |
|
$ |
|
|||
(1) Comprised primarily of corporate bonds and commercial paper |
|
|
|
|
|
|
|
||||||||
As of December 31, 2022, the fair values of available-for-sale marketable securities, by remaining contractual maturity, were as follows (in thousands):
Due within one year |
|
|
|
|
|
|
$ |
|
|
Due in one to five years |
|
|
|
|
|
|
|
|
|
Total |
|
|
|
|
|
|
$ |
|
The Company typically invests in highly rated securities, with the primary objective of minimizing the potential risk of principal loss. The Company’s investment policy generally requires securities to be investment grade and limits the amount of credit exposure to any one issuer. Fair values were determined for each individual security in the investment portfolio.
The Company does not believe that any unrealized losses are attributable to credit-related factors based on its evaluation of available evidence. To determine whether a decline in value is related to credit loss, the Company evaluates, among other factors: the extent to which the fair value is less than the amortized cost basis, changes to the rating of the security by a rating agency and any adverse conditions specifically related to an issuer of a security or its industry. The Company does not intend to sell the instruments and it is not more likely than not that the Company will be required to sell the investments before recovery of their amortized cost bases, which may be maturity. Unrealized gain and losses on marketable securities are presented net of tax.
84
The following tables present information about the Company’s financial assets measured at fair value on a recurring basis as of December 31, 2022 and 2021, and indicate the fair value hierarchy of the valuation inputs utilized to determine such fair value (in thousands):
|
|
December 31, 2022 |
|
|||||||||||||
|
|
Level 1 |
|
|
Level 2 |
|
|
Level 3 |
|
|
Total |
|
||||
Cash equivalents: |
|
|
|
|
|
|
|
|
|
|
|
|
||||
Money market funds |
|
$ |
|
|
$ |
|
|
$ |
|
|
$ |
|
||||
Marketable securities: |
|
|
|
|
|
|
|
|
|
|
|
|
||||
Corporate securities |
|
|
|
|
|
|
|
|
|
|
|
|
||||
U.S. treasury and agency securities |
|
|
|
|
|
|
|
|
|
|
|
|
||||
Total financial assets |
|
$ |
|
|
$ |
|
|
$ |
|
|
$ |
|
||||
|
|
December 31, 2021 |
|
|||||||||||||
|
|
Level 1 |
|
|
Level 2 |
|
|
Level 3 |
|
|
Total |
|
||||
Cash equivalents: |
|
|
|
|
|
|
|
|
|
|
|
|
||||
Money market funds |
|
$ |
|
|
$ |
|
|
$ |
|
|
$ |
|
||||
Marketable securities: |
|
|
|
|
|
|
|
|
|
|
|
|
||||
Corporate securities |
|
|
|
|
|
|
|
|
|
|
|
|
||||
U.S. treasury and agency securities |
|
|
|
|
|
|
|
|
|
|
|
|
||||
Total financial assets |
|
$ |
|
|
$ |
|
|
$ |
|
|
$ |
|
||||
The Company classifies its highly liquid money market funds and U.S treasury securities within Level 1 of the fair value hierarchy because they are valued based on quoted market prices in active markets. The Company classifies its commercial paper, corporate bonds, and U.S. agency securities within Level 2 because they are valued using inputs other than quoted prices that are directly or indirectly observable in the market, including readily available pricing sources for the identical underlying security which may not be actively traded.
The Company maintains an allowance for doubtful receivables that in management’s judgement reflects losses inherent in the portfolio. A provision for doubtful receivables is recorded to adjust the level of the allowance as deemed necessary by management.
Changes in the allowance for doubtful trade receivables for the year ended December 31, 2022, 2021 and 2020 were as follows (in thousands):
|
|
Year ended December 31, |
|
|||||||||
|
|
2022 |
|
|
2021 |
|
|
2020 |
|
|||
Beginning balance |
|
$ |
|
|
$ |
|
|
$ |
|
|||
Provision for bad debt |
|
|
|
|
|
|
|
|
|
|||
Net write-offs |
|
|
|
|
|
|
|
|
|
|||
Write-offs |
|
|
( |
) |
|
|
( |
) |
|
|
( |
) |
Recoveries |
|
|
|
|
|
|
|
|
|
|||
Net write-offs |
|
|
( |
) |
|
|
( |
) |
|
|
( |
) |
Ending balance |
|
$ |
|
|
$ |
|
|
$ |
|
|||
85
Changes in the allowance for doubtful finance receivables for the year ended December 31, 2022, 2021 and 2020 were as follows (in thousands):
|
|
Year ended December 31, |
|
|||||||||
|
|
2022 |
|
|
2021 |
|
|
2020 |
|
|||
Beginning balance |
|
$ |
|
|
$ |
|
|
$ |
|
|||
Provision for bad debt |
|
|
|
|
|
|
|
|
|
|||
Net write-offs |
|
|
|
|
|
|
|
|
|
|||
Write-offs |
|
|
( |
) |
|
|
( |
) |
|
|
( |
) |
Recoveries |
|
|
|
|
|
|
|
|
|
|||
Net write-offs |
|
|
( |
) |
|
|
( |
) |
|
|
( |
) |
Ending balance |
|
$ |
|
|
$ |
|
|
$ |
|
|||
The increase in write-offs was the result of more challenging macroeconomic conditions in 2022 which impacted our customers. The recorded investment in finance receivables on nonaccrual status was
Property and equipment, net consisted of the following at December 31, 2022 and 2021 (in thousands):
|
|
2022 |
|
|
2021 |
|
||
Computer equipment and devices |
|
$ |
|
|
$ |
|
||
Inspection and trade show equipment |
|
|
|
|
|
|
||
Furniture and fixtures |
|
|
|
|
|
|
||
Leasehold improvements |
|
|
|
|
|
|
||
|
|
|
|
|
|
|
||
Less accumulated depreciation |
|
|
( |
) |
|
|
( |
) |
Property and equipment, net |
|
$ |
|
|
$ |
|
||
Depreciation expense for the year ended December 31, 2022, 2021 and 2020 totaled $
Internal-use software costs, net consisted of the following for the year ended December 31, 2022 (in thousands):
|
|
December 31, 2022 |
|
|||||||||||||
|
|
Weighted average remaining amortization period (in years) |
|
|
Gross |
|
|
Accumulated |
|
|
Net |
|
||||
Capitalized Software - In-service |
|
|
|
|
$ |
|
|
$ |
( |
) |
|
$ |
|
|||
Capitalized Software - Work in Progress |
|
N/A |
|
|
|
|
|
|
|
|
|
|
||||
Total Capitalized Software |
|
|
|
|
$ |
|
|
$ |
( |
) |
|
$ |
|
|||
86
Internal-use software costs, net consisted of the following for the year ended December 31, 2021 (in thousands):
|
|
December 31, 2021 |
|
|||||||||||||
|
|
Weighted average remaining amortization period (in years) |
|
|
Gross |
|
|
Accumulated |
|
|
Carrying |
|
||||
Capitalized Software - In-service |
|
|
|
|
$ |
|
|
$ |
( |
) |
|
$ |
|
|||
Capitalized Software - Work in Progress |
|
N/A |
|
|
|
|
|
|
|
|
|
|
||||
Total Capitalized Software |
|
|
|
|
$ |
|
|
$ |
( |
) |
|
$ |
|
|||
Amortization expense for the years ended December 31, 2022, 2021 and 2020, totaled $
Estimated amortization expense on existing internal-use software costs for the next three years is as follows (in thousands):
Year ended December 31, |
|
|
|
|
2023 |
|
|
|
|
2024 |
|
|
|
|
2025 |
|
|
|
|
Total |
|
$ |
|
|
The Company provides certain guarantees to Sellers in the Marketplace in the ordinary course of business, which are accounted for under ASC 460 as a general guarantee.
Vehicle Condition Guarantees – Sellers must attach a vehicle condition report in the Marketplace for every auction; this vehicle condition report is used by Buyers to inform bid decisions. The Company offers guarantees to Sellers in qualifying situations where the Company performed a vehicle inspection and prepared the vehicle condition report. Sellers must pay an additional fee in exchange for this guarantee. The guarantee provides Sellers protection from paying remedies to Buyers related to a Buyer’s claim that the vehicle condition report did not accurately portray the condition of the vehicle purchased on the Marketplace. The guarantee provides the Company with the right to retain proceeds from the subsequent liquidation of the vehicle covered under the guarantee. The guarantee is typically provided for
The recognized probable loss contingency, in excess of vehicle condition guarantees recognized, presented in Accrued other liabilities was $
Other Price Guarantees – The Company provides Sellers with a price guarantee for vehicles to be sold on the Marketplace from time to time. If a vehicle sells below the guaranteed price, the Company is responsible for paying the Seller the difference between the guaranteed price and the final sale price. The term of the guarantee is typically less than one week. No material unsettled price guarantees existed at December 31, 2022 and 2021.
87
Litigation – The Company and its subsidiaries are subject in the normal course of business to various pending and threatened legal proceedings and matters in which claims for monetary damages are asserted. On an on-going basis management, after consultation with legal counsel, assesses the Company's liabilities and contingencies in connection with such proceedings. For those matters where it is probable that the Company will incur losses and the amounts of the losses can be reasonably estimated, the Company records an expense and corresponding liability in its consolidated financial statements. To the extent pending or threatened litigation could result in exposure in excess of the recorded liability, the amount of such excess is not currently estimable.
On March 19, 2021, a putative class action was filed by Jerry Gradl Motors, Inc., et al. against ACV Auctions Inc., et al. in the U.S. District Court for the Western District of New York (the “Court”), alleging violations of the federal antitrust laws and New York State law related to an alleged conspiracy to set bids on our marketplace from transactions that originated from one seller. The complaint seeks statutory damages under such laws and other relief. In July 2021, the complaint was amended to add and modify allegations beyond the initial complaint, as well as to add certain individuals as individual defendants, including George Chamoun, the Company's Chief Executive Officer. In January 2022, the Court heard arguments on the motion to dismiss that the defendants had previously filed and dismissed the federal claims with leave for the plaintiff to amend their complaint. In the fourth quarter of 2022, the Company recorded a liability for litigation matters in anticipation of the settlement. As of January 31, 2023, the complaint has been settled and dismissed by the court.
2019 Revolver
On December 20, 2019, the Company entered into a revolving credit facility (the "2019 Revolver"). The 2019 Revolver was established to provide debt financing in support of the short-term finance receivable product offered to eligible customers purchasing vehicles through the Marketplace and is fully secured by the underlying finance receivable assets. On June 25, 2021 the Company entered into the First Amendment to Loan and Security Agreement ("The First Amendment"), which modified the interest rate to the London Interbank Offered Rate, or LIBOR (or a benchmark replacement in accordance with the First Amendment) plus
The amount available for borrowing under the 2019 Revolver is based on the size of the finance receivable portfolio. As of December 31, 2022, $
The revolving feature on the facility ends on
2021 Revolver
On August 24, 2021, the Company entered into a revolving credit facility (the "2021 Revolver"). The 2021 Revolver was established to provide general financing to the Company. The 2021 Revolver is secured by substantially all of the Company's assets. The maximum borrowing principal amount of the 2021 Revolver is $
As of December 31, 2022, there was an outstanding letter of credit issued under the 2021 Revolver in the amount of $
88
The Company’s outstanding long-term debt consisted of the following at December 31, 2022 and 2021 (in thousands):
|
|
|
|
|
|
December 31, |
|
|
December 31, |
|
||
|
|
Interest Rate |
|
Maturity Date |
|
2022 |
|
|
2021 |
|
||
2019 Revolver |
|
|
|
$ |
|
|
$ |
|
||||
2021 Revolver |
|
|
|
|
|
|
|
|
||||
Total long-term debt |
|
|
|
|
|
$ |
|
|
$ |
|
||
|
|
|||||||||||
The Company leases office space under operating leases expiring at various dates through 2028. For the years ended December 31, 2022, 2021 and 2020, the Company incurred operating lease costs of $
Maturities of lease liabilities as of December 31, 2022 were as follows (in thousands):
2023 |
|
|
|
$ |
|
|
2024 |
|
|
|
|
|
|
2025 |
|
|
|
|
|
|
2026 |
|
|
|
|
|
|
2027 |
|
|
|
|
|
|
Thereafter |
|
|
|
|
|
|
Total lease payments |
|
|
|
|
|
|
Less imputed interest |
|
|
|
|
( |
) |
Total |
|
|
|
$ |
|
The following amounts relate to operating leases were recorded on the Company's Consolidated Balance Sheets at December 31, 2022 and 2021 (in thousands):
|
|
2022 |
|
|
2021 |
|
||
Operating lease right of use assets: |
|
|
|
|
|
|
||
$ |
|
|
$ |
|
|
|||
Operating lease liabilities: |
|
|
|
|
|
|
||
$ |
|
|
$ |
|
|
|||
Other long-term liabilities |
$ |
|
|
$ |
|
|
||
The Company recorded right of use assets in exchange for new lease liabilities of $
89
Convertible Preferred Stock
Upon closing of the IPO on March 26, 2021, all of the then-outstanding shares of convertible preferred stock automatically converted into
Common Stock
On March 11, 2021, the Board of Directors and the stockholders of the Company approved an amended and restated certificate of incorporation that implemented a dual class common stock structure where all existing shares of common stock converted to Class B common stock and a new class of common stock, Class A common stock, became authorized. The amended and restated certificate of incorporation became effective immediately prior to the closing of the IPO on March 26, 2021. The authorized share capital of Class A common stock of the Company is
The following table summarizes the primary components of Marketplace and service revenue. This level of disaggregation takes into consideration how the nature, amount, timing, and uncertainty of revenue and cash flows are affected by economic factors for the years ended December 31, 2022, 2021 and 2020 (in thousands):
|
2022 |
|
|
2021 |
|
|
2020 |
|
|||
Auction marketplace revenue |
$ |
|
|
$ |
|
|
$ |
|
|||
Other marketplace revenue |
|
|
|
|
|
|
|
|
|||
Data services revenue |
|
|
|
|
|
|
|
|
|||
Marketplace and service revenue |
$ |
|
|
$ |
|
|
$ |
|
|||
Effective March 20, 2015, the Company adopted the ACV Auctions Inc. 2015 Long-Term Incentive Plan (the “2015 Plan”). Employees, outside directors, consultants and advisors of the Company were eligible to participate in the Plan. The 2015 Plan allowed for the grant of incentive or nonqualified common stock options to purchase shares of the Company’s common stock and also to issue restricted shares of the common stock. Each common stock option or restricted stock agreement stipulates the terms of the grant, including vesting, contractual life, exercise price, and other provisions.
Effective March 23, 2021, the Company adopted the ACV Auctions Inc. 2021 Equity Incentive Plan (the "2021 Plan"). The 2021 Plan became effective on the date of the underwriting agreement related to the IPO, and no further grants were made under the 2015 Plan. All shares that remained available for issuance under the 2015 Plan at that time were transferred to the 2021 Plan. Employees, outside directors, consultants and advisors of the Company are eligible to participate in the 2021 Plan. The 2021 Plan allows the grant of incentive stock options, nonstatutory stock options, stock appreciation rights, restricted stock awards, restricted stock units ("RSUs"), performance awards, and other forms of awards.
90
Common stock options generally vest and become exercisable over a four-year service period with 25% vesting one year from the date of grant or service-inception date and ratably vesting monthly over the remaining three-year period. RSUs generally vest and become exercisable over a three or
Effective March 23, 2021, the Company adopted the ACV Auctions Inc. 2021 Employee Stock Purchase Plan (the "2021 ESPP"), which became effective on the date of the underwriting agreement related to the IPO. The 2021 ESPP authorizes the issuance of shares of the Company's Class A common stock pursuant to purchase rights granted to employees ("employee stock purchase rights"). As of December 31, 2022,
The following table summarizes assumptions used in estimating the fair value of ESPP for purchase periods during the year ended December 31, 2022:
Expected term (in years) |
|
|
Expected volatility |
|
|
Risk-free interest rate |
|
|
Expected dividend yield |
|
Effective February 22, 2022, the Company entered into an escrow agreement (the "Escrow Agreement") for certain compensatory share-based service awards. The Escrow Agreement authorized
The following table summarizes the stock option activity for the year ended December 31, 2022 (in thousands, except for share data):
|
|
Number of |
|
|
Weighted- |
|
|
Intrinsic |
|
|
Weighted- |
|
||||
Outstanding, December 31, 2021 |
|
|
|
|
$ |
|
|
$ |
|
|
|
|
||||
Granted |
|
|
|
|
|
|
|
|
|
|
|
|
||||
Exercised |
|
|
( |
) |
|
|
|
|
|
|
|
|
|
|||
Forfeited |
|
|
( |
) |
|
|
|
|
|
|
|
|
|
|||
Expired |
|
|
( |
) |
|
|
|
|
|
|
|
|
|
|||
Outstanding, December 31, 2022 |
|
|
|
|
$ |
|
|
$ |
|
|
|
|
||||
Exercisable, December 31, 2022 |
|
|
|
|
$ |
|
|
$ |
|
|
|
|
||||
Expected to Vest, December 31, 2022 |
|
|
|
|
$ |
|
|
$ |
|
|
|
|
||||
91
Stock options exercised during the years ended December 31, 2021 and 2020 were
The following table summarizes the RSU activity for the year ended December 31, 2022 (in thousands, except for share data):
|
|
Number of RSUs |
|
|
Weighted- |
|
||
Outstanding, December 31, 2021 |
|
|
|
|
$ |
|
||
Granted |
|
|
|
|
|
|
||
Vested |
|
|
( |
) |
|
|
|
|
Forfeited |
|
|
( |
) |
|
|
|
|
Outstanding, December 31, 2022 |
|
|
|
|
$ |
|
||
The weighted-average grant-date fair value of RSU's granted during the years ended December 31, 2021 and 2020 was $
The following are the weighted-average assumptions for options issued during the years ended December 31, 2022, 2021 and 2020:
|
|
2022* |
|
|
2021 |
|
|
2020 |
|
|||
Expected term (in years) |
|
|
|
|
|
|
|
|
|
|||
Risk-free interest rate |
|
|
|
|
|
% |
|
|
% |
|||
Expected volatility |
|
|
|
|
|
% |
|
|
% |
|||
Expected dividend yield |
|
|
|
|
|
% |
|
|
% |
|||
* There were no stock options issued during 2022 |
|
|||||||||||
The fair value of options vested and the intrinsic value from the exercise of options for the years ended December 31, 2022, 2021 and 2020 are as follows (in thousands):
|
|
2022 |
|
|
2021 |
|
|
2020 |
|
|||
Fair value of options vested |
|
$ |
|
|
$ |
|
|
$ |
|
|||
Intrinsic value of options exercised |
|
$ |
|
|
$ |
|
|
$ |
|
|||
The weighted-average grant date fair value of options issued during 2021 and 2020 was $
Total stock-based compensation expense recognized for restricted stock units and common stock options has been reported in the Consolidated Statements of Operations as follows (in thousands):
|
|
2022 |
|
|
2021 |
|
|
2020 |
|
|||
Marketplace and service cost of revenue |
|
$ |
|
|
$ |
|
|
$ |
|
|||
Operations and technology |
|
|
|
|
|
|
|
|
|
|||
Selling, general, and administrative |
|
|
|
|
|
|
|
|
|
|||
Stock-based compensation, net of amount capitalized |
|
|
|
|
|
|
|
|
|
|||
Capitalized stock-based compensation |
|
|
|
|
|
|
|
|
|
|||
Stock-based compensation expense |
|
$ |
|
|
$ |
|
|
$ |
|
|||
92
The compensation expense related to the unvested portion of common stock options and restricted stock units was approximately $
The Company sponsors a 401(k) Profit Sharing Plan covering eligible employees. The Company contributes to this plan on a discretionary basis.
The Company’s management evaluates its tax positions to determine whether it is more likely than not that a tax position will be sustained upon examination, including resolution of any related appeals or litigation, based on the technical merits of the tax position. Management has analyzed the Company’s tax positions, and concluded that, as of December 31, 2022 , 2021 and 2020 there are
On August 16, 2022, the U.S. Inflation Reduction Act of 2022 (the "IRA") was signed into U.S. law. The IRA includes various tax provisions, including a
The components of loss from continuing operations before income taxes for the years ended December 31, 2022, 2021 and 2020 are summarized below (in thousands):
|
|
2022 |
|
|
2021 |
|
|
2020 |
|
|||
Pre tax book income (loss): |
|
|
|
|
|
|
|
|
|
|||
Domestic |
|
$ |
( |
) |
|
$ |
( |
) |
|
$ |
( |
) |
Foreign |
|
|
( |
) |
|
|
|
|
|
|
||
Total pre tax book income (loss) |
|
$ |
( |
) |
|
$ |
( |
) |
|
$ |
( |
) |
The components of income tax expense for the years ended December 31, 2022, 2021 and 2020 are summarized below (in thousands):
|
|
2022 |
|
|
2021 |
|
|
2020 |
|
|||
Current expense (benefit): |
|
|
|
|
|
|
|
|
|
|||
Federal |
|
$ |
( |
) |
|
$ |
|
|
$ |
|
||
Foreign |
|
|
|
|
|
|
|
|
|
|||
State |
|
|
|
|
|
|
|
|
|
|||
Total current expense (benefit) |
|
|
|
|
|
|
|
|
|
|||
Deferred expense (benefit): |
|
|
|
|
|
|
|
|
|
|||
Federal |
|
|
|
|
|
|
|
|
|
|||
Foreign |
|
|
( |
) |
|
|
|
|
|
|
||
State |
|
|
|
|
|
|
|
|
|
|||
Total deferred expense (benefit) |
|
|
( |
) |
|
|
|
|
|
|
||
Total income tax expense |
|
$ |
|
|
$ |
|
|
$ |
|
|||
93
The Company’s deferred tax assets (liabilities) consisted of the following at December 31, 2022 and 2021 (in thousands):
|
2022 |
|
|
2021 |
|
||
Deferred tax assets: |
|
|
|
|
|
||
Net operating loss carryforwards |
$ |
|
|
$ |
|
||
Excess depreciation and amortization |
|
|
|
|
|
||
Deferred compensation |
|
|
|
|
|
||
Lease liability |
|
|
|
|
|
||
Accruals and reserves |
|
|
|
|
|
||
Total gross deferred tax asset |
|
|
|
|
|
||
Less valuation allowance |
|
( |
) |
|
|
( |
) |
Total net deferred tax asset |
|
|
|
|
|
||
Deferred tax liabilities: |
|
|
|
|
|
||
Excess depreciation and amortization |
|
|
|
|
( |
) |
|
Right of use asset |
|
( |
) |
|
|
( |
) |
Indefinite lived intangible |
|
( |
) |
|
|
( |
) |
Net deferred tax liability |
$ |
( |
) |
|
$ |
( |
) |
The Company measures deferred tax assets and liabilities using enacted tax rates that apply in the year in which the temporary differences are expected to be recovered or paid. A valuation allowance is provided for deferred tax assets (excluding certain deferred tax liabilities related to indefinite lived intangibles) if management believes that it is more likely than not that these items will either expire before the Company is able to realize their benefit or that future realizability is uncertain. The Company recorded a valuation allowance of $
A reconciliation of income taxes at the federal statutory rate of
|
|
2022 |
|
|
2021 |
|
|
2020 |
|
|||
Income tax benefit at federal statutory rate |
|
$ |
( |
) |
|
$ |
( |
) |
|
$ |
( |
) |
State income taxes, net of federal income tax benefit |
|
|
( |
) |
|
|
( |
) |
|
|
( |
) |
Foreign rate differential |
|
|
( |
) |
|
|
|
|
|
|
||
Permanent differences |
|
|
|
|
|
( |
) |
|
|
|
||
Stock based compensation |
|
|
|
|
|
( |
) |
|
|
( |
) |
|
Executive compensation disallowance |
|
|
|
|
|
|
|
|
|
|||
Increase in valuation allowance |
|
|
|
|
|
|
|
|
|
|||
Other |
|
|
|
|
|
|
|
|
|
|||
Provision for income taxes |
|
$ |
|
|
$ |
|
|
$ |
|
|||
For the year ended December 31, 2022, the provision for income taxes includes a non-cash tax charge of approximately $
At December 31, 2022, the Company had US federal, state, and France net operating loss ("NOL") carryforwards for income tax purposes of approximately $
94
Utilization of the net operating loss and credit carryforwards may be subject to an annual limitation due to the ownership limitations provided by the Internal Revenue Code of 1986, as amended (the “Code”), and similar state provisions. Any annual limitation may result in the expiration of net operating losses and credits before utilization.
At December 31, 2022, any undistributed earnings of the Company's foreign subsidiaries are considered to be indefinitely reinvested and, accordingly,
2022 Acquisition
On February 22, 2022, the Company completed its acquisition of Monk SaS for total consideration of $
Monk SAS is an AI company delivering state of the art visual processing capabilities for the automotive, insurance and mobility markets. The acquisition of Monk enables the Company to enhance its service offerings and inspection capabilities for dealers and commercial partners. The transaction was accounted for using the acquisition method and, accordingly, the results of the acquired business have been included in the Company's results of operations from the acquisition date. In connection with the acquisition, the Company has incurred approximately $
2021 Acquisitions
During the year ended December 31, 2021, the Company completed business combinations for total consideration of approximately $
The transactions were accounted for using the acquisition method and, accordingly, the results of the acquired business have been included in the Company's results of operations from the acquisition date. In connection with the acquisitions, the Company incurred approximately $
95
Changes to the carrying amount of goodwill are as follows (in thousands):
|
|
2022 |
|
|
2021 |
|
||
Beginning balance |
|
$ |
|
|
$ |
|
||
Acquisitions |
|
|
|
|
|
|
||
Foreign currency translation |
|
|
( |
) |
|
|
|
|
Measurement period adjustments |
|
|
|
|
|
|
||
Ending balance |
|
$ |
|
|
$ |
|
||
Acquired intangible assets, net consisted of the following (in thousands):
|
|
|
|
December 31, 2022 |
|
|
December 31, 2021 |
|
||||||||||||||||||
|
|
Useful Lives |
|
Gross |
|
|
Accumulated Amortization |
|
|
Carrying |
|
|
Gross |
|
|
Accumulated Amortization |
|
|
Carrying |
|
||||||
Customer relationships |
|
|
$ |
|
|
$ |
( |
) |
|
$ |
|
|
$ |
|
|
$ |
( |
) |
|
$ |
|
|||||
Developed technology |
|
|
|
|
|
|
( |
) |
|
|
|
|
|
|
|
|
( |
) |
|
|
|
|||||
Other acquired intangibles |
|
|
|
|
|
|
( |
) |
|
|
|
|
|
|
|
|
( |
) |
|
|
|
|||||
Total |
|
|
|
$ |
|
|
$ |
( |
) |
|
$ |
|
|
$ |
|
|
$ |
( |
) |
|
$ |
|
||||
At December 31, 2022, customer relationships, developed technology, and other acquired intangibles had weighted-average remaining useful lives of
Estimated amortization expense on acquired intangible assets for the next five years and thereafter is as follows (in thousands):
Year ended December 31, |
|
|
|
|
2023 |
|
$ |
|
|
2024 |
|
|
|
|
2025 |
|
|
|
|
2026 |
|
|
|
|
2027 |
|
|
|
|
Thereafter |
|
|
|
|
Total |
|
$ |
|
|
96
The numerators and denominators of the basic and diluted net income (loss) per share computations for our common stock are calculated as follows (in thousands, except share data):
|
|
Year ended December 31, |
|
|||||||||||||||||
|
|
2022 |
|
|
2021 |
|
|
2020 |
|
|||||||||||
|
|
Class A |
|
|
Class B |
|
|
Class A |
|
|
Class B |
|
|
|
|
|||||
Numerator: |
|
|
|
|
|
|
|
|
|
|
|
|
|
|
|
|||||
Net income (loss) attributable to common |
|
$ |
( |
) |
|
$ |
( |
) |
|
$ |
( |
) |
|
$ |
( |
) |
|
$ |
( |
) |
Denominator: |
|
|
|
|
|
|
|
|
|
|
|
|
|
|
|
|||||
Weighted-average number of shares of |
|
|
|
|
|
|
|
|
|
|
|
|
|
|
|
|||||
Net income (loss) per share attributable to common |
|
|
|
|
|
|
|
|
|
|
|
|
|
|
|
|||||
Basic and diluted |
|
$ |
( |
) |
|
$ |
( |
) |
|
$ |
( |
) |
|
$ |
( |
) |
|
$ |
( |
) |
The following table presents the total weighted-average number of potentially dilutive shares that were excluded from the computation of diluted net income (loss) per share attributable to common stockholders because their effect would have been anti-dilutive for the period presented:
|
|
Year ended December 31, |
|
|||||||||
|
|
2022 |
|
|
2021 |
|
|
2020 |
|
|||
Convertible Preferred Stock Series Seed I, Seed II, |
|
|
|
|
|
|
|
|
|
|||
Unvested RSUs and other awards |
|
|
|
|
|
|
|
|
|
|||
Stock options |
|
|
|
|
|
|
|
|
|
|||
Shares subject to the employee stock purchase plan |
|
|
|
|
|
|
|
|
|
|||
97
Item 9. Changes in and Disagreements With Accountants on Accounting and Financial Disclosure.
Not applicable.
Item 9A. Controls and Procedures.
Evaluation of Disclosure Controls and Procedures
We maintain “disclosure controls and procedures,” as defined in Rule 13a-15(e) and Rule 15d-15(e) under the Exchange Act, that are designed to ensure that information required to be disclosed by a company in the reports that it files or submits under the Exchange Act is recorded, processed, summarized and reported, within the time periods specified in the SEC’s rules and forms. Disclosure controls and procedures include, without limitation, controls and procedures designed to ensure that information required to be disclosed by a company in the reports that it files or submits under the Exchange Act is accumulated and communicated to our management, including our principal executive and principal financial officers, as appropriate to allow timely decisions regarding required disclosure.
Our management, with the participation of our Chief Executive Officer and our Chief Financial Officer, evaluated the effectiveness of our disclosure controls and procedures as of December 31, 2022. Based on the evaluation of our disclosure controls and procedures as of December 31, 2022, our Chief Executive Officer and Chief Financial Officer concluded that, as of such date, our disclosure controls and procedures were effective at the reasonable assurance level.
Management’s Report on Internal Control over Financial Reporting
Our management is responsible for establishing and maintaining adequate internal control over financial reporting as defined in Rules 13a-15(f) and 15d-15(f) of the Exchange Act. Our management conducted an evaluation of the effectiveness of our internal control over financial reporting as of December 31, 2022 based on the criteria set forth in the Internal Control Integrated Framework issued by the Committee of Sponsoring Organizations of the Treadway Commission (2013 framework).
Based on its evaluation, our management concluded that our internal control over financial reporting was effective as of December 31, 2022. Our independent registered public accounting firm, Ernst & Young LLP, has issued an auditors' report on the effectiveness of our internal control over financial reporting, which is included in Part II, Item 8 of this Annual Report on Form 10-K.
Changes in Internal Control over Financial Reporting
There was no change in our internal control over financial reporting identified in connection with the evaluation required by Rule 13a-15(d) and 15d-15(d) of the Exchange Act that occurred during the period covered by this Annual Report on Form 10-K that has materially affected, or is reasonably likely to materially affect, our internal control over financial reporting.
Inherent Limitations on Effectiveness of Controls
98
Our management, including our Chief Executive Officer and Chief Financial Officer, believes that our disclosure controls and procedures and internal control over financial reporting are designed to provide reasonable assurance of achieving their objectives and are effective at the reasonable assurance level. However, management does not expect that our disclosure controls and procedures or our internal control over financial reporting will prevent or detect all errors and fraud. A control system, no matter how well conceived and operated, can provide only reasonable, not absolute, assurance that the objectives of the control system are met. Because of the inherent limitations in all control systems, no evaluation of controls can provide absolute assurance that all control issues and instances of fraud, if any, within the company have been detected. The design of any system of controls also is based in part upon certain assumptions about the likelihood of future events, and there can be no assurance that any design will succeed in achieving its stated goals under all potential future conditions. Over time, controls may become inadequate because of changes in conditions, or the degree of compliance with the policies or procedures may deteriorate. Because of the inherent limitations in a cost-effective control system, misstatements due to error or fraud may occur and not be detected.
Item 9B. Other Information.
Not applicable.
Item 9C. Disclosure Regarding Foreign Jurisdictions that Prevent Inspections.
Not applicable.
99
PART III
Item 10. Directors, Executive Officers and Corporate Governance.
The information required by this item is incorporated by reference to the information set forth in our Proxy Statement relating to our 2023 Annual Meeting of Stockholders, to be filed with the SEC within 120 days after the end of our fiscal year ended December 31, 2022.
Item 11. Executive Compensation.
The information required by this item is incorporated by reference to the information set forth in our Proxy Statement relating to our 2023 Annual Meeting of Stockholders.
Item 12. Security Ownership of Certain Beneficial Owners and Management and Related Stockholder Matters.
The information required by this item is incorporated by reference to the information set forth in our Proxy Statement relating to our 2023 Annual Meeting of Stockholders.
Item 13. Certain Relationships and Related Transactions, and Director Independence.
The information required by this item is incorporated by reference to the information set forth in our Proxy Statement relating to our 2023 Annual Meeting of Stockholders.
Item 14. Principal Accountant Fees and Services.
The information required by this item is incorporated by reference to the information set forth in our Proxy Statement relating to our 2023 Annual Meeting of Stockholders.
100
PART IV
Item 15. Exhibits and Financial Statement Schedules.
Report of Ernst & Young LLP, Independent Registered Public Accounting Firm (PCAOB ID: 42)
Consolidated Statements of Operations for the Years ended December 31, 2022, 2021, and 2020
Consolidated Statements of Comprehensive Loss for the Years ended December 31, 2022, 2021, and 2020
Consolidated Balance Sheets as of December 31, 2022 and 2021
Consolidated Statements of Changes in Convertible Preferred Stock and Stockholders' Equity (Deficit) for the Years ended December 31, 2022, 2021, and 2020
Consolidated Statements of Cash Flows for the Years ended December 31, 2022, 2021, and 2020
Notes to Consolidated Financial Statements
All financial statement schedules have been omitted because the required information is included in the consolidated financial statements or the notes thereto, or because it is not required.
101
Exhibit Index
|
Exhibit Number |
|
Description |
Form |
File No. |
Exhibit |
Filing Date |
Filed Herewith |
3.1 |
|
Amended and Restated Certificate of Incorporation of the Registrant. |
8-K |
001-40256 |
3.1 |
March 26, 2021 |
|
3.2 |
|
8-K |
001-40256 |
3.2 |
March 26, 2021 |
|
|
4.1 |
|
S-1/A |
333-253617 |
4.1 |
March 15, 2021 |
|
|
4.2 |
|
|
|
|
|
X |
|
10.1 |
|
Fifth Amended and Restated Investors’ Rights Agreement, dated as of September 2, 2020. |
S-1 |
333-253617 |
10.1 |
February 26, 2021 |
|
10.2+ |
|
2015 Long-Term Incentive Plan, as amended March 11, 2021, and forms of agreements thereunder. |
S-1/A |
333-253617 |
10.2 |
March 15, 2021 |
|
10.3+ |
|
2021 Equity Incentive Plan and forms of agreements thereunder. |
S-1/A |
333-253617 |
10.3 |
March 15, 2021 |
|
10.4+ |
|
S-1/A |
333-253617 |
10.4 |
March 15, 2021 |
|
|
10.5+ |
|
S-1/A |
333-253617 |
10.5 |
March 15, 2021 |
|
|
10.6+ |
|
S-1 |
333-253617 |
10.6 |
February 26, 2021 |
|
|
10.7 |
|
S-1 |
333-253617 |
10.7 |
February 26, 2021 |
|
|
10.8 |
|
S-1 |
333-253617 |
10.8 |
February 26, 2021 |
|
|
10.9+ |
|
S-1/A |
333-253617 |
10.9 |
March 15, 2021 |
|
|
10.10+ |
|
S-1/A |
333-253617 |
10.10 |
March 15, 2021 |
|
|
10.11+ |
|
S-1/A |
333-253617 |
10.11 |
March 15, 2021 |
|
|
10.12+ |
|
S-1/A |
333-253617 |
10.12 |
March 15, 2021 |
|
|
10.13 |
|
10-Q |
001-40256 |
10.1 |
November 10, 2021 |
|
|
21.1 |
|
|
|
|
|
X |
102
23.1 |
|
Consent of Ernst & Young LLP, independent registered public accounting firm. |
|
|
|
|
X |
24.1 |
|
Power of Attorney (included on the signature page to this Annual Report on Form 10-K). |
|
|
|
|
X |
31.1 |
|
|
|
|
|
X |
|
31.2 |
|
|
|
|
|
X |
|
32.1* |
|
|
|
|
|
X |
|
32.2* |
|
|
|
|
|
X |
|
101.INS |
|
Inline XBRL Instance Document – the instance document does not appear in the Interactive Data File because XBRL tags are embedded within the Inline XBRL document. |
|
|
|
|
|
101.SCH |
|
Inline XBRL Taxonomy Extension Schema Document |
|
|
|
|
|
101.CAL |
|
Inline XBRL Taxonomy Extension Calculation Linkbase Document |
|
|
|
|
|
101.DEF |
|
Inline XBRL Taxonomy Extension Definition Linkbase Document |
|
|
|
|
|
101.LAB |
|
Inline XBRL Taxonomy Extension Label Linkbase Document |
|
|
|
|
|
101.PRE |
|
Inline XBRL Taxonomy Extension Presentation Linkbase Document |
|
|
|
|
|
104 |
|
Cover Page Interactive Data File (embedded within the Inline XBRL document) |
|
|
|
|
|
_______________________________________
+ Indicates management contract or compensatory plan
* This certification is deemed not filed for purposes of Section 18 of the Securities Exchange Act of 1934, as amended, or otherwise subject to the liability of that section, nor shall it be deemed incorporated by reference into any filing under the Securities Act of 1933, as amended, or the Securities Exchange Act of 1934, as amended, whether made before or after the date hereof, regardless of any general incorporation language in such filing.
103
Item 16. Form 10-K Summary
None.
104
SIGNATURES
Pursuant to the requirements of Section 13 or 15(d) of the Securities Exchange Act of 1934, as amended, the Registrant has duly caused this Report to be signed on its behalf by the undersigned, thereunto duly authorized.
|
|
ACV Auctions Inc |
|
|
|
|
|
Date: March 1, 2023 |
|
By: |
/s/ George Chamoun |
|
|
|
George Chamoun |
|
|
|
Chief Executive Officer |
POWER OF ATTORNEY
KNOW ALL PERSONS BY THESE PRESENTS, that each person whose signature appears below constitutes and appoints George Chamoun and William Zerella, and each one of them, as his or her true and lawful attorneys-in-fact and agents, with full power of substitution and resubstitution, for him or her and in their name, place and stead, in any and all capacities, to sign any and all amendments to this Annual Report on Form 10-K, and to file the same, with all exhibits thereto and other documents in connection therewith, with the Securities and Exchange Commission, granting unto said attorneys-in-fact and agents, and each of them, full power and authority to do and perform each and every act and thing requisite and necessary to be done in connection therewith, as fully to all intents and purposes as he or she might or could do in person, hereby ratifying and confirming all that said attorneys-in-fact and agents or any of them, or his or her substitute or substitutes, may lawfully do or cause to be done by virtue hereof.
Pursuant to the requirements of the Securities Exchange Act of 1934, as amended, this Report has been signed below by the following persons on behalf of the Registrant in the capacities and on the dates indicated.
Name |
|
Title |
|
Date |
|
|
|
|
|
/s/ George Chamoun |
|
Chief Executive Officer and Director |
|
March 1, 2023 |
George Chamoun |
|
(Principal Executive Officer) |
|
|
|
|
|
|
|
/s/ William Zerella |
|
Chief Financial Officer |
|
March 1, 2023 |
William Zerella |
|
(Principal Financial and Accounting Officer) |
|
|
|
|
|
|
|
/s/ Kirsten Castillo |
|
Director |
|
March 1, 2023 |
Kirsten Castillo |
|
|
|
|
|
|
|
|
|
/s/ Robert P. Goodman |
|
Director |
|
March 1, 2023 |
Robert P. Goodman |
|
|
|
|
|
|
|
|
|
/s/ Brian Hirsch |
|
Director |
|
March 1, 2023 |
Brian Hirsch |
|
|
|
|
|
|
|
|
|
/s/ René F. Jones |
|
Director |
|
March 1, 2023 |
René F. Jones |
|
|
|
|
|
|
|
|
|
/s/ Eileen A. Kamerick |
|
Director |
|
March 1, 2023 |
Eileen A. Kamerick |
|
|
|
|
|
|
|
|
|
/s/ Brian Radecki |
|
Director |
|
March 1, 2023 |
Brian Radecki |
|
|
|
|
105